Fig. C.1
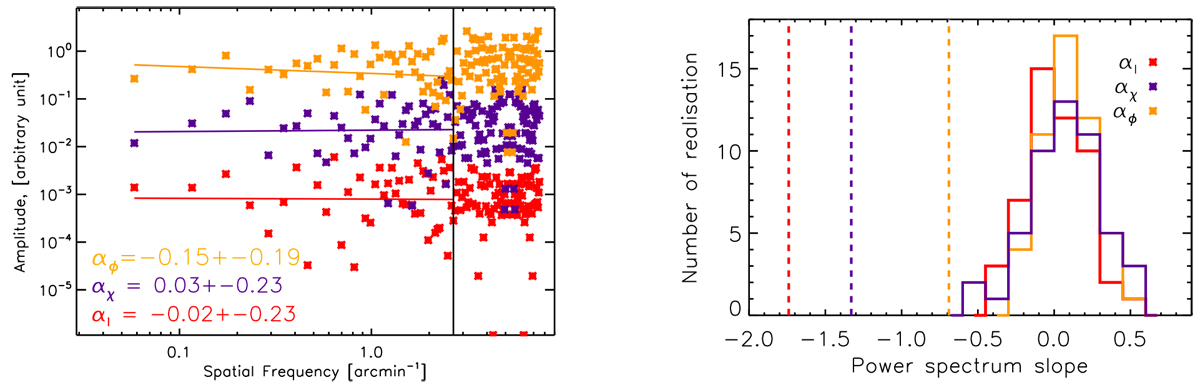
Left: a power spectrum example of the test data (intensity in red, POS B-field angle in purple, and difference angle in yellow), where the observed values along the ridge crest are randomly reordered. The vertical line shows the spatial resolution of the data. The data points have pixel size of 4′′. The straight colored lines show the best power-law fits to the power spectra and the derived power-law indexes (α) are shown on the bottom left hand side of the plot. Right: histogram of α for 50 realisations of random reorganization of the observed values. The vertical dashed lines indicate the derived power spectrum slopes from the observed values (see Fig. 16).
Current usage metrics show cumulative count of Article Views (full-text article views including HTML views, PDF and ePub downloads, according to the available data) and Abstracts Views on Vision4Press platform.
Data correspond to usage on the plateform after 2015. The current usage metrics is available 48-96 hours after online publication and is updated daily on week days.
Initial download of the metrics may take a while.