Fig. B.2
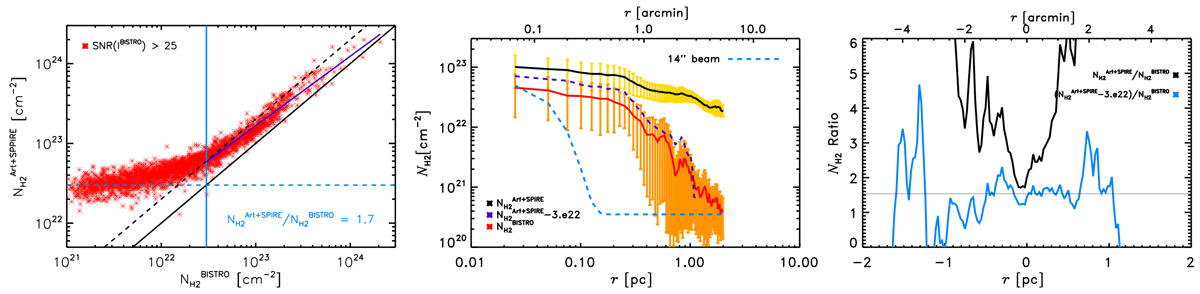
Left: comparing the column density values derived from ArTéMiS+SPIRE (![]() ) at 350 μm (from André et al. 2016) and BISTRO (
) at 350 μm (from André et al. 2016) and BISTRO (![]() ) at 850 μm (see Appendix B.2 for the expression used to estimate the column density from the observed total intensity). The vertical blue line indicates
) at 850 μm (see Appendix B.2 for the expression used to estimate the column density from the observed total intensity). The vertical blue line indicates
![]() above which the two maps agree within a factor <2. The oblique black solid and dashed lines show the y = x
and y = 2x
relations. Middle: radial column density profiles (in log scale) perpendicular to and averaged along the 10 pc NGC 6334 elongated structure (i.e., crests from 1 to 5 in Fig. 10). The solid black and red lines correspond to the average profiles derived from ArTéMiS+SPIRE and BISTRO data, respectively. The purple dashed curve corresponds to
above which the two maps agree within a factor <2. The oblique black solid and dashed lines show the y = x
and y = 2x
relations. Middle: radial column density profiles (in log scale) perpendicular to and averaged along the 10 pc NGC 6334 elongated structure (i.e., crests from 1 to 5 in Fig. 10). The solid black and red lines correspond to the average profiles derived from ArTéMiS+SPIRE and BISTRO data, respectively. The purple dashed curve corresponds to
![]() , where
, where ![]() correspondsto the large scale “Galactic emission” filtered out in the BISTRO maps. The angular resolution of the data isindicated by the blue dashed Gaussian function. Right: mean profiles (in linear scale) of the ratios
correspondsto the large scale “Galactic emission” filtered out in the BISTRO maps. The angular resolution of the data isindicated by the blue dashed Gaussian function. Right: mean profiles (in linear scale) of the ratios
![]() (black) and
(black) and ![]() (blue). The mean value of this latter ratio is ~1.5 indicated bythe horizontal line.
(blue). The mean value of this latter ratio is ~1.5 indicated bythe horizontal line.
Current usage metrics show cumulative count of Article Views (full-text article views including HTML views, PDF and ePub downloads, according to the available data) and Abstracts Views on Vision4Press platform.
Data correspond to usage on the plateform after 2015. The current usage metrics is available 48-96 hours after online publication and is updated daily on week days.
Initial download of the metrics may take a while.