Fig. B.1
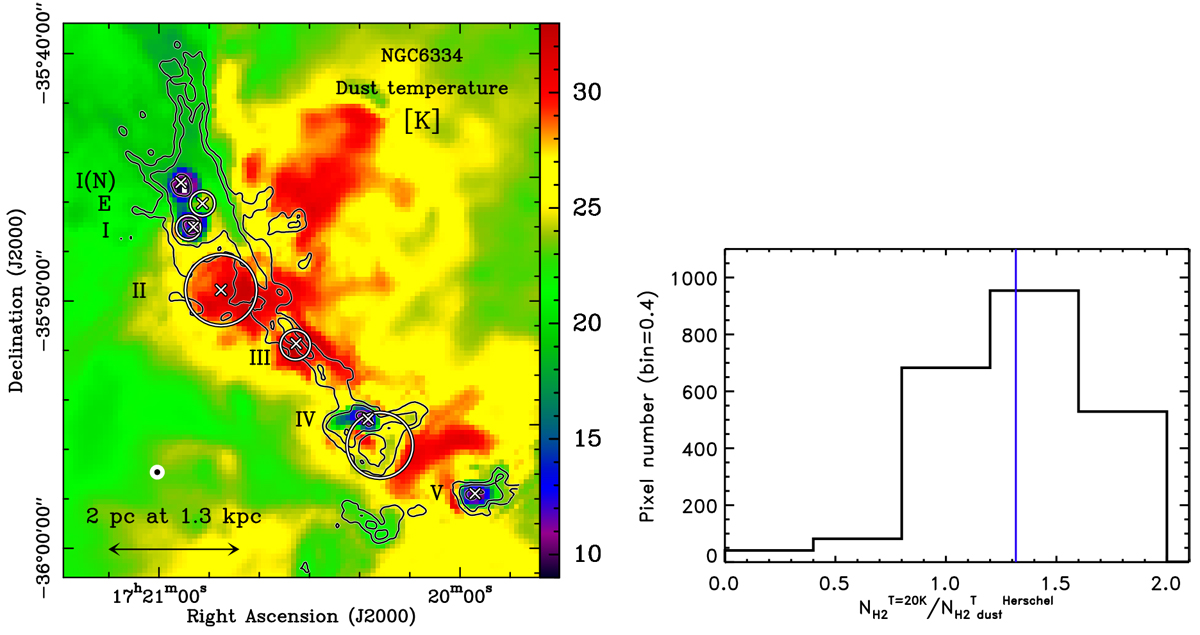
Left: dust temperature ![]() map (Russeil et al. 2013) derived from Herschel
data observed as part of the HOBYS key program (Motte et al. 2010). This map is at the resolution of 36′′. The contours (corresponding to I = 0.4, 1.4, and 8 Jy beam−1
of the BISTRO data), the crosses, and the circles are the same as in Fig. 1-top-left. The
Herschel
(36′′) and BISTRO (14′′) beams are shown on the left bottom of the plot as concentric filled white and black circles, respectively. Right: distribution of the ratio
map (Russeil et al. 2013) derived from Herschel
data observed as part of the HOBYS key program (Motte et al. 2010). This map is at the resolution of 36′′. The contours (corresponding to I = 0.4, 1.4, and 8 Jy beam−1
of the BISTRO data), the crosses, and the circles are the same as in Fig. 1-top-left. The
Herschel
(36′′) and BISTRO (14′′) beams are shown on the left bottom of the plot as concentric filled white and black circles, respectively. Right: distribution of the ratio ![]() (see Appendix B.1 describing the derivation of the two quantities). The mean value of this distribution is 1.3, as indicated by the vertical line.
(see Appendix B.1 describing the derivation of the two quantities). The mean value of this distribution is 1.3, as indicated by the vertical line.
Current usage metrics show cumulative count of Article Views (full-text article views including HTML views, PDF and ePub downloads, according to the available data) and Abstracts Views on Vision4Press platform.
Data correspond to usage on the plateform after 2015. The current usage metrics is available 48-96 hours after online publication and is updated daily on week days.
Initial download of the metrics may take a while.