Free Access
Fig. A.5
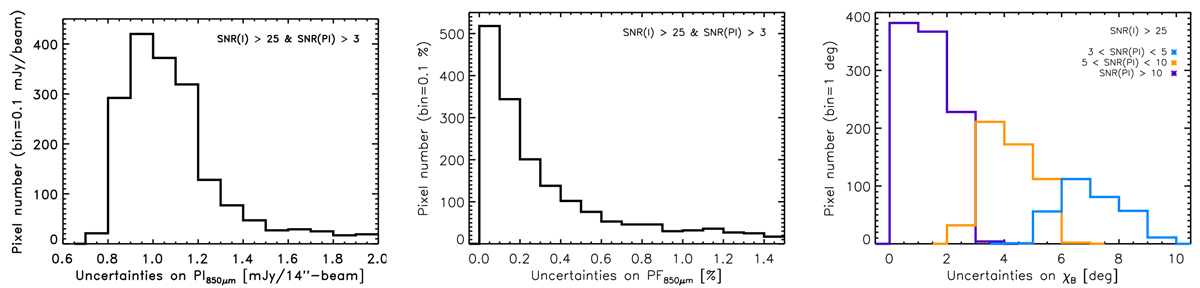
Distributions of the uncertainties on PI (left), PF (middle), and ![]() (right) for SNR(I) > 25 and SNR(PI) > 3 corresponding to the maps shown in Fig. A.1. Right hand side plot: different colors are as follow: blue for 3 < SNR(PI) < 5, orange for 5 < SNR(PI) < 10, and purple for SNR(PI) >10.
(right) for SNR(I) > 25 and SNR(PI) > 3 corresponding to the maps shown in Fig. A.1. Right hand side plot: different colors are as follow: blue for 3 < SNR(PI) < 5, orange for 5 < SNR(PI) < 10, and purple for SNR(PI) >10.
Current usage metrics show cumulative count of Article Views (full-text article views including HTML views, PDF and ePub downloads, according to the available data) and Abstracts Views on Vision4Press platform.
Data correspond to usage on the plateform after 2015. The current usage metrics is available 48-96 hours after online publication and is updated daily on week days.
Initial download of the metrics may take a while.