Fig. A.1
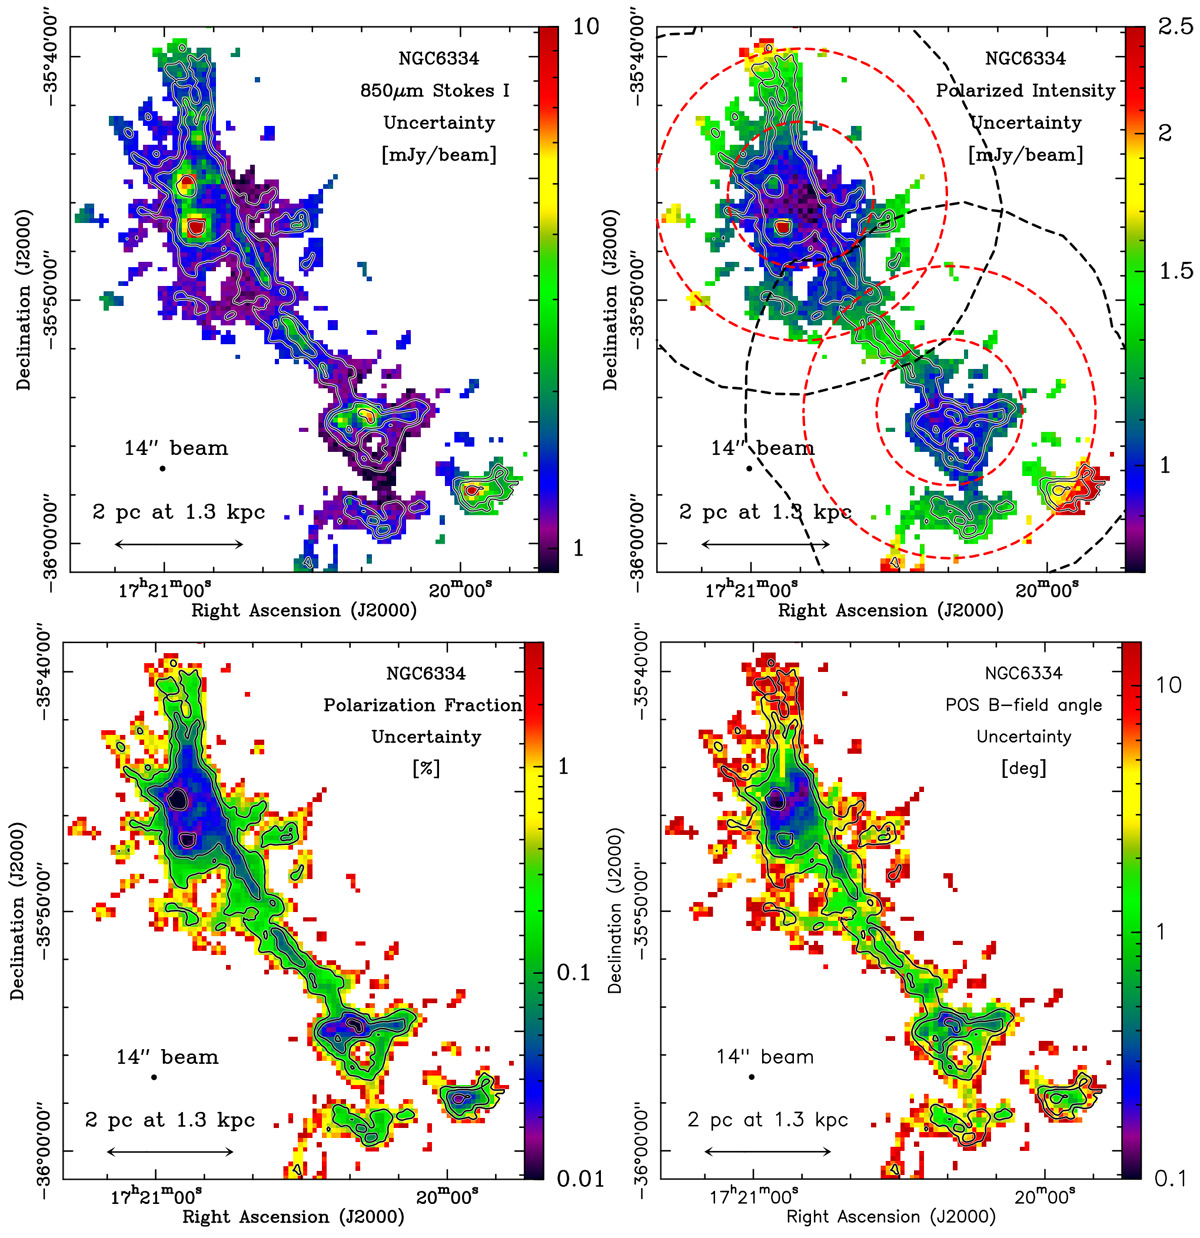
Maps showing the distribution of the uncertainties derived for Stokes I, PI, PF, and ![]() from left to right and top to bottom. The HPBW resolution of these maps is 14′′. The same emission area is plotted for all the four maps corresponding to
SNR(I) > 25. The contours, which are the same for all the plots, correspond to I = 0.4, 1.4, and 8 Jy beam−1
or
from left to right and top to bottom. The HPBW resolution of these maps is 14′′. The same emission area is plotted for all the four maps corresponding to
SNR(I) > 25. The contours, which are the same for all the plots, correspond to I = 0.4, 1.4, and 8 Jy beam−1
or ![]() and 37) × 1022 cm−2
(as in Fig. 1). The black dashed circles over-plotted on the PI map (top right) indicate the limits of the two observed DAISY subfields centered on (17:20:50.011, −35:45:34.33) and (17:20:19.902, −35:54:30.45) in (RA J2000, Dec J2000) for the north and south fields, respectively. The small and large red dashed circles have sizes of 6′ and 12′.
and 37) × 1022 cm−2
(as in Fig. 1). The black dashed circles over-plotted on the PI map (top right) indicate the limits of the two observed DAISY subfields centered on (17:20:50.011, −35:45:34.33) and (17:20:19.902, −35:54:30.45) in (RA J2000, Dec J2000) for the north and south fields, respectively. The small and large red dashed circles have sizes of 6′ and 12′.
Current usage metrics show cumulative count of Article Views (full-text article views including HTML views, PDF and ePub downloads, according to the available data) and Abstracts Views on Vision4Press platform.
Data correspond to usage on the plateform after 2015. The current usage metrics is available 48-96 hours after online publication and is updated daily on week days.
Initial download of the metrics may take a while.