Fig. 21
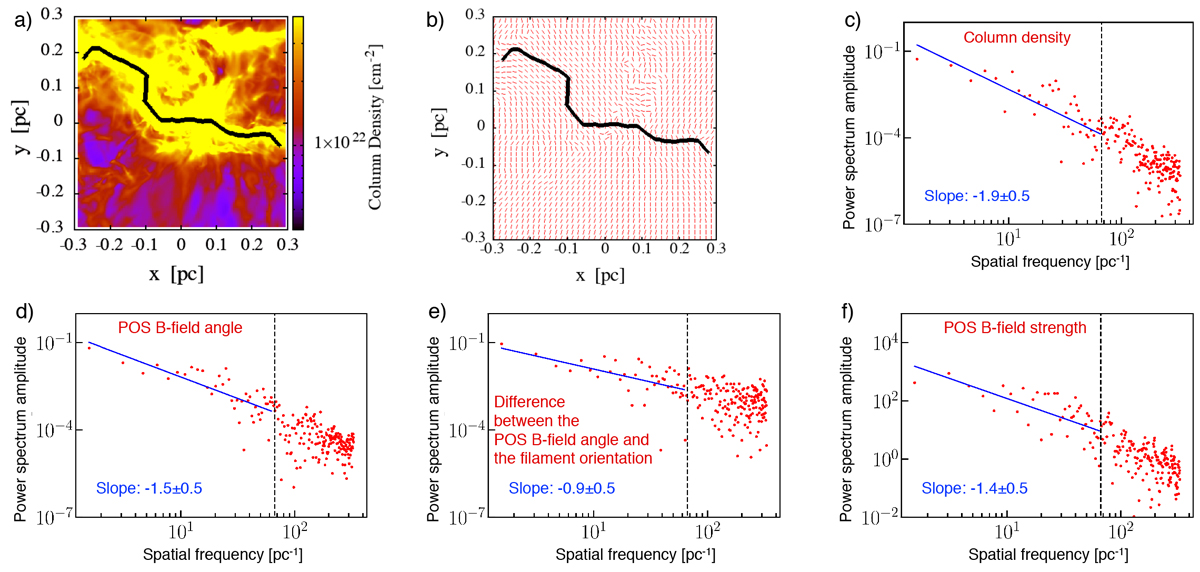
Results derived from the MHD numerical simulation presented by Inoue et al. (2018). The selected snapshot corresponds to t = 0.7 Myr after the filament formation by shock compression. The mass per unit length of the filament at this epoch is ~ 120 M⊙ pc−1. (a) Column density map of the filament. The black curve shows the crest of the filament traced with FilFinder (Koch & Rosolowsky 2015). (b) The small red lines indicate the POS B-field angle toward the same region shown in panel a. The black curve is the crest of the filament.(c)–(f) Power spectra of the column density, the POS B-field angle, the difference of the angle between the POS B-field orientation and the filament orientation, and the B-field strength, respectively. The slopes derived from the power law fits (shown in blue) to each of the power spectra are indicated on the panels. The vertical black dashed line indicates the highest frequency data point used to fit the power-law corresponding to 10 computational cells.
Current usage metrics show cumulative count of Article Views (full-text article views including HTML views, PDF and ePub downloads, according to the available data) and Abstracts Views on Vision4Press platform.
Data correspond to usage on the plateform after 2015. The current usage metrics is available 48-96 hours after online publication and is updated daily on week days.
Initial download of the metrics may take a while.