Fig. 18
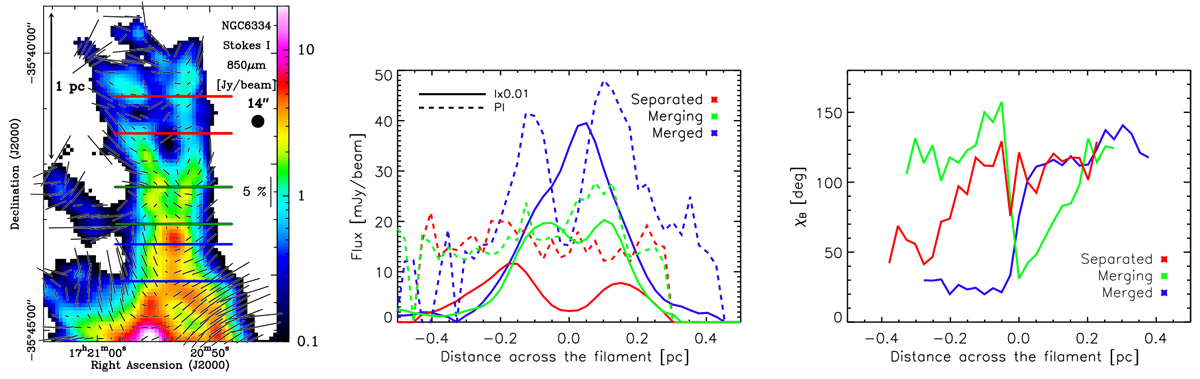
Left: Stokes I map of the northern region of NGC 6334 toward the sub-filaments 5 and 6 (see Fig. 10). The black lines correspond to ![]() and their lengths are proportional to PF. On the right hand side, a vertical line indicates the 5% PF scale. The black filled circle indicates the 14′′ beam. The horizontal blue, green, and red lines show the (0.8 pc) cuts used to derive the profiles shown on the middle and right panels, for the merged, merging, and separated profiles, respectively. Middle: three transverse cuts, from east to west, where the sub-filaments are still separated (red), where they are merging (green), and where they are merged (blue) and not distinguishable any more as two peaks in Stokes
I. Each profile has been averaged vertically between the two lines of the same color indicated on the left hand side plot. The solid and dashed line profiles show Stokes I
and PI, respectively. We see a drop of PI toward the peak in I
when the two filaments merge, that may be due to depolarization via beam-smearing of the B-field where the two sub-filaments merge. Right: same as the middle panel for the variation of
and their lengths are proportional to PF. On the right hand side, a vertical line indicates the 5% PF scale. The black filled circle indicates the 14′′ beam. The horizontal blue, green, and red lines show the (0.8 pc) cuts used to derive the profiles shown on the middle and right panels, for the merged, merging, and separated profiles, respectively. Middle: three transverse cuts, from east to west, where the sub-filaments are still separated (red), where they are merging (green), and where they are merged (blue) and not distinguishable any more as two peaks in Stokes
I. Each profile has been averaged vertically between the two lines of the same color indicated on the left hand side plot. The solid and dashed line profiles show Stokes I
and PI, respectively. We see a drop of PI toward the peak in I
when the two filaments merge, that may be due to depolarization via beam-smearing of the B-field where the two sub-filaments merge. Right: same as the middle panel for the variation of
![]() across the two sub-filaments.
across the two sub-filaments.
Current usage metrics show cumulative count of Article Views (full-text article views including HTML views, PDF and ePub downloads, according to the available data) and Abstracts Views on Vision4Press platform.
Data correspond to usage on the plateform after 2015. The current usage metrics is available 48-96 hours after online publication and is updated daily on week days.
Initial download of the metrics may take a while.