Fig. 16
Power spectra of I,
![]() , and ϕdiff
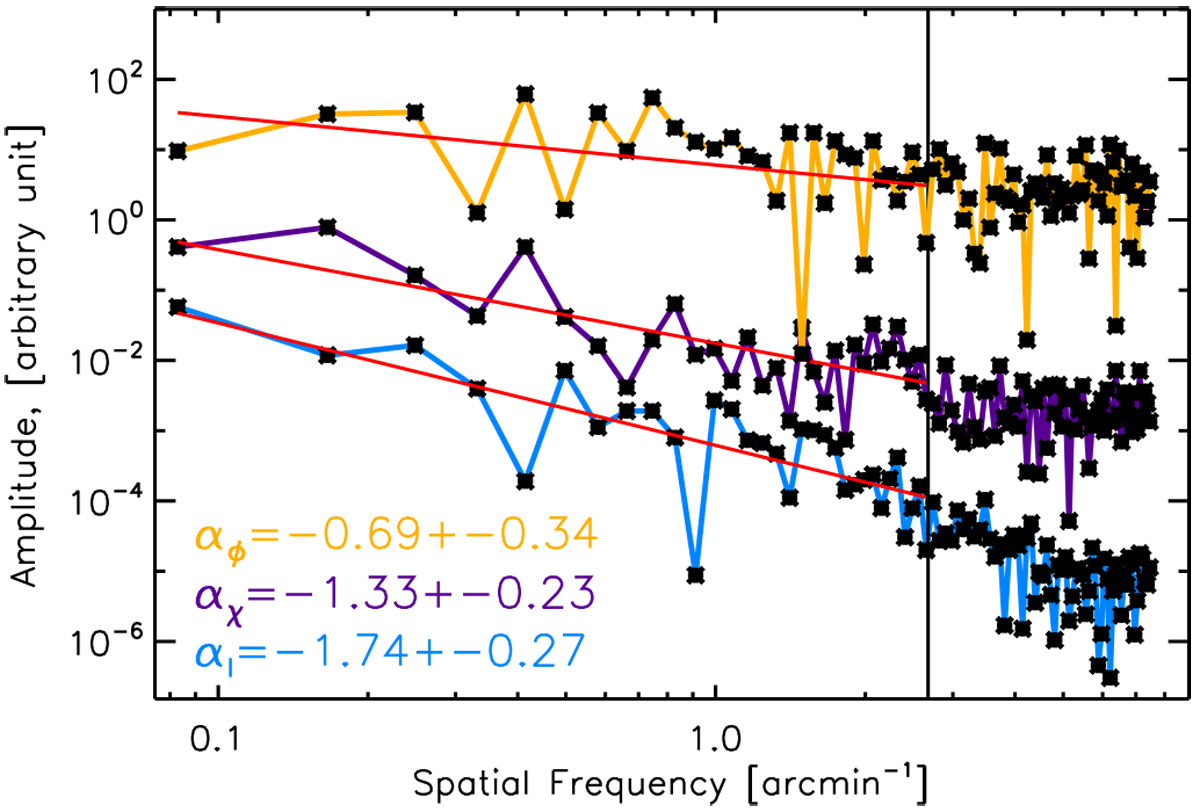
in blue, purple, and yellow, respectively, observed along the crest ridge combining crests 3 and 4 (Fig. 10). The amplitudes are scaled to conveniently show the three power spectra on the same plot. The red solid lines indicate the best fit linear function (in log-log) to the observed power spectra. The derived best fit slopes are given in the bottom left of the plot,
αI in blue, αχ
in purple, and αϕ
in yellow, forthe power spectra of I,
, and ϕdiff
in blue, purple, and yellow, respectively, observed along the crest ridge combining crests 3 and 4 (Fig. 10). The amplitudes are scaled to conveniently show the three power spectra on the same plot. The red solid lines indicate the best fit linear function (in log-log) to the observed power spectra. The derived best fit slopes are given in the bottom left of the plot,
αI in blue, αχ
in purple, and αϕ
in yellow, forthe power spectra of I,
![]() , and ϕdiff, respectively. The vertical black solid line indicates the 14′′
HPBW
of the data at 850 μm (s ~ 2.7 arcmin−1), which is also the highest frequency data point used to fit the power-law.
, and ϕdiff, respectively. The vertical black solid line indicates the 14′′
HPBW
of the data at 850 μm (s ~ 2.7 arcmin−1), which is also the highest frequency data point used to fit the power-law.
Current usage metrics show cumulative count of Article Views (full-text article views including HTML views, PDF and ePub downloads, according to the available data) and Abstracts Views on Vision4Press platform.
Data correspond to usage on the plateform after 2015. The current usage metrics is available 48-96 hours after online publication and is updated daily on week days.
Initial download of the metrics may take a while.