Fig. 14
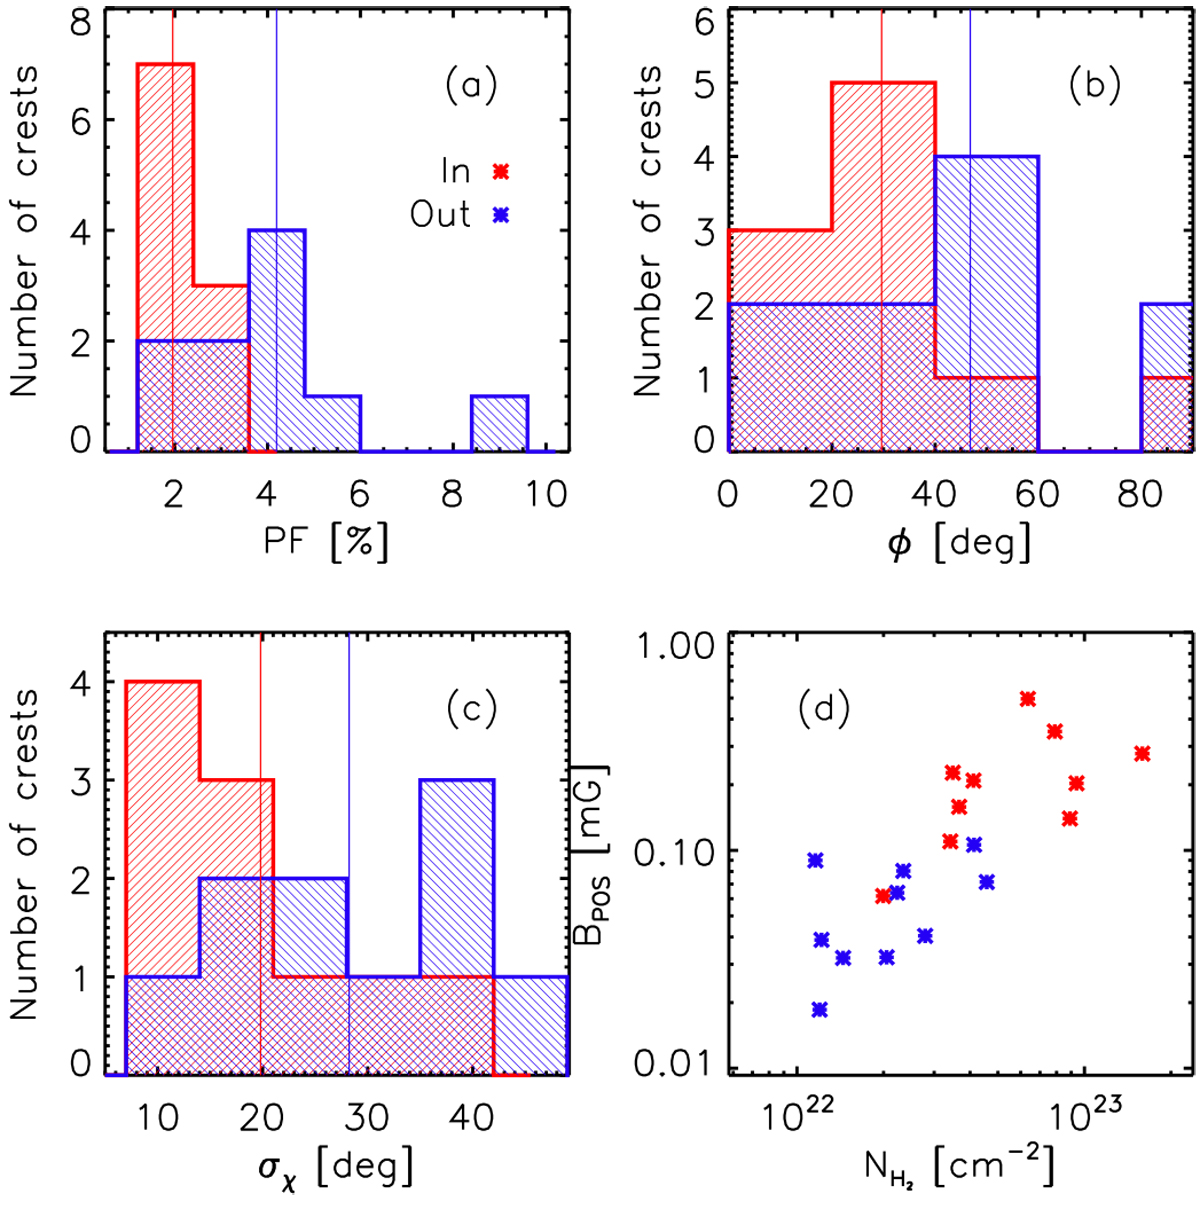
Distributions of properties measured toward the in (red) and out (blue) parts of the 10 sub-filaments: a) polarization fraction, b)
![]() , difference between the filament orientation θfil
and the POSB-field angle
, difference between the filament orientation θfil
and the POSB-field angle ![]() ,
c) dispersion of
,
c) dispersion of![]() ,
d) POS B-fieldstrength as a function of the column density. The red and blue vertical lines indicate the median of the distributions of the properties measured toward the in and out parts of the sub-filaments, respectively (see text for details and Tables 1 and 2 for the values).
,
d) POS B-fieldstrength as a function of the column density. The red and blue vertical lines indicate the median of the distributions of the properties measured toward the in and out parts of the sub-filaments, respectively (see text for details and Tables 1 and 2 for the values).
Current usage metrics show cumulative count of Article Views (full-text article views including HTML views, PDF and ePub downloads, according to the available data) and Abstracts Views on Vision4Press platform.
Data correspond to usage on the plateform after 2015. The current usage metrics is available 48-96 hours after online publication and is updated daily on week days.
Initial download of the metrics may take a while.