Fig. 13
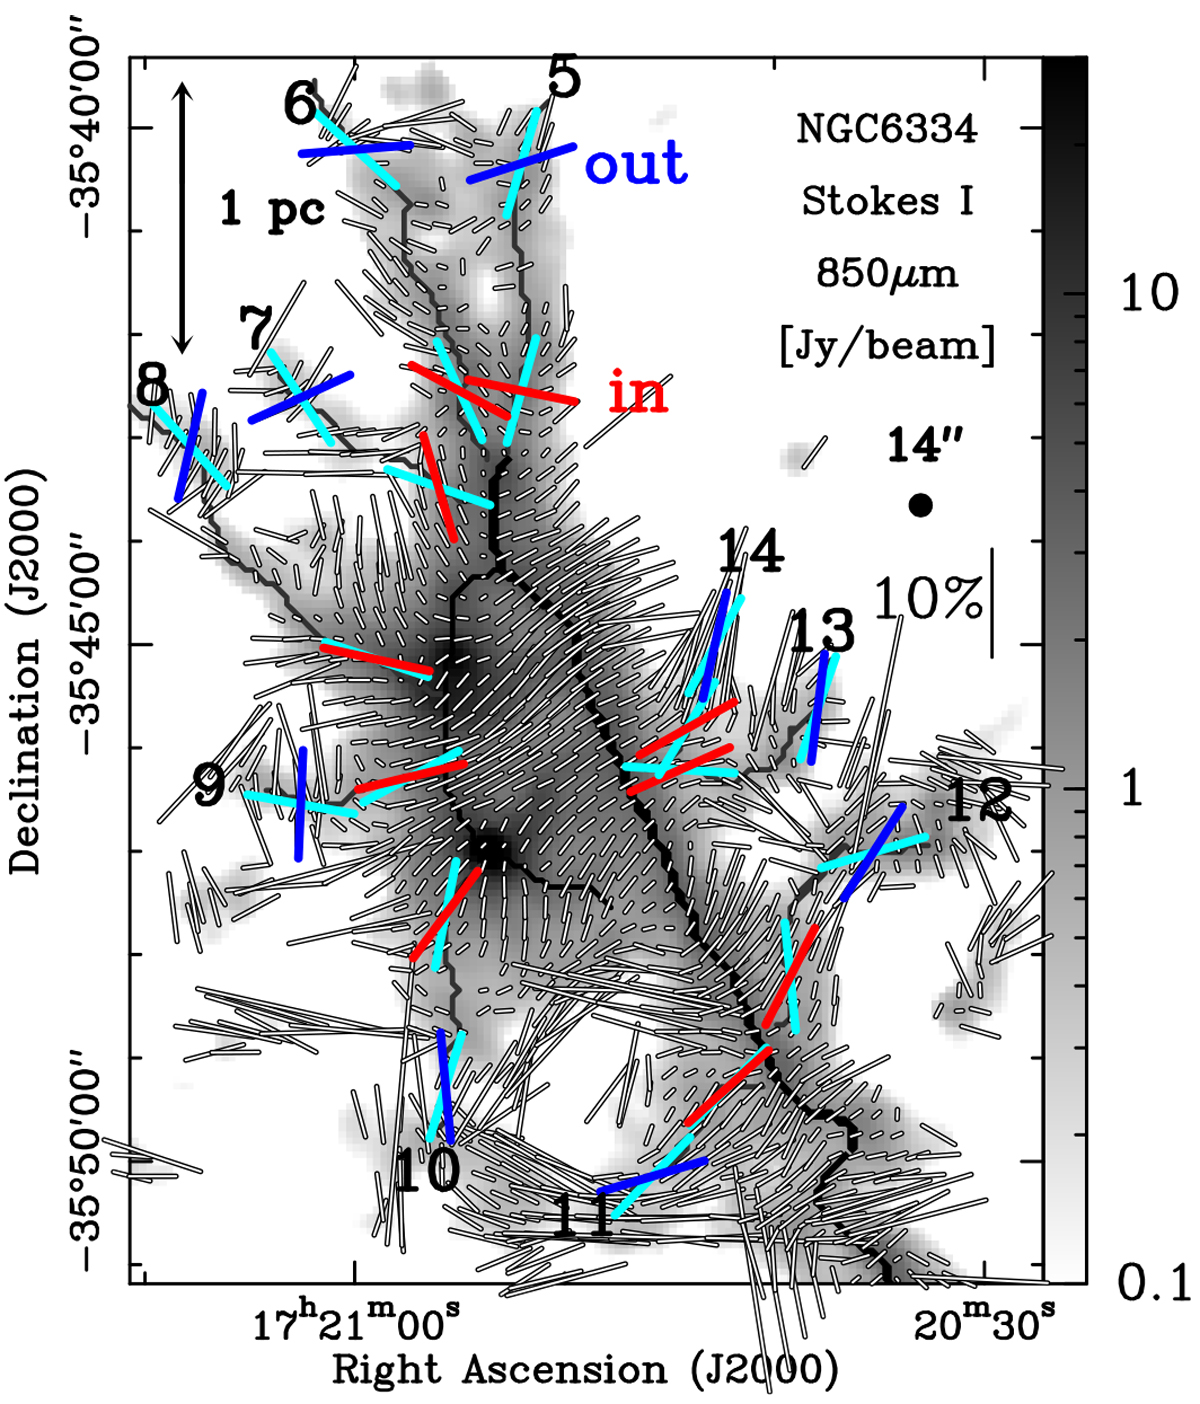
Close-up of the northern region of NGC 6334 within the black dashed rectangle indicated in Fig. 10. The crests are those shown in Fig. 10 and over-plotted on the Stokes I
map. The white lines correspond to ![]() and their lengths are proportional to PF. On the right hand side, a vertical line shows the
10% polarization fraction scale. The black filled circle corresponds to the 14′′
beam. The blue and red lines indicate the mean values for
and their lengths are proportional to PF. On the right hand side, a vertical line shows the
10% polarization fraction scale. The black filled circle corresponds to the 14′′
beam. The blue and red lines indicate the mean values for ![]() for the out and in parts of the sub-filaments, respectively. The cyan lines show the orientation (θfil) of the out and in parts of the sub-filaments (see Sect. 4.2, Fig. 14, and Table 1). The length of the blue, red, and cyan lines is equal to 60′′, corresponding to the extent of the circular area used to estimate the parameters.
for the out and in parts of the sub-filaments, respectively. The cyan lines show the orientation (θfil) of the out and in parts of the sub-filaments (see Sect. 4.2, Fig. 14, and Table 1). The length of the blue, red, and cyan lines is equal to 60′′, corresponding to the extent of the circular area used to estimate the parameters.
Current usage metrics show cumulative count of Article Views (full-text article views including HTML views, PDF and ePub downloads, according to the available data) and Abstracts Views on Vision4Press platform.
Data correspond to usage on the plateform after 2015. The current usage metrics is available 48-96 hours after online publication and is updated daily on week days.
Initial download of the metrics may take a while.