Fig. 12
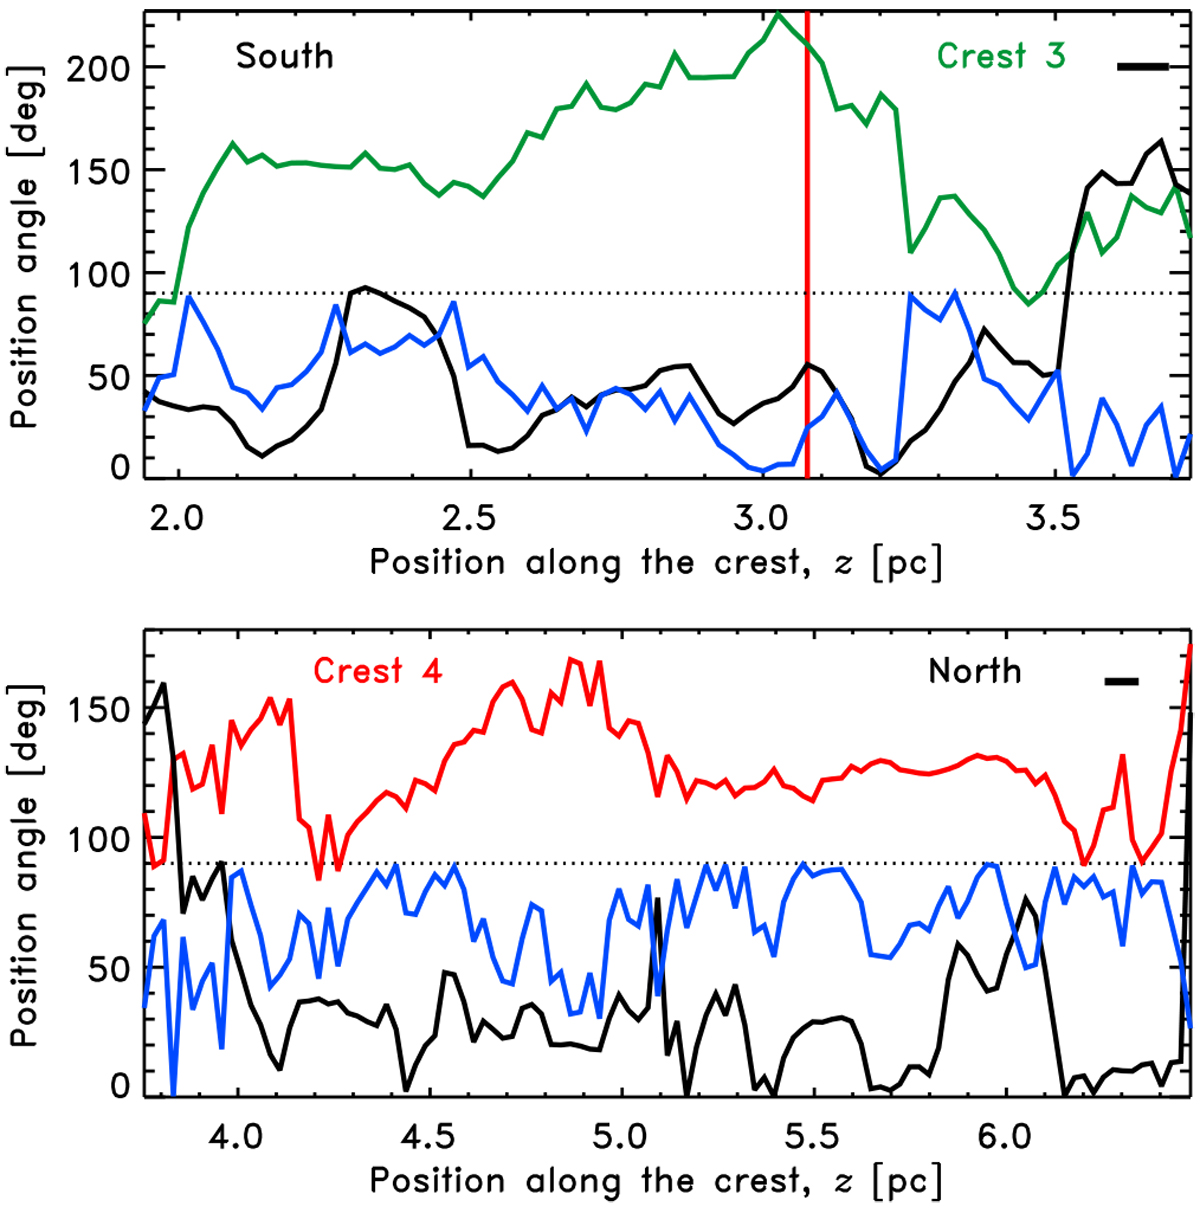
Variation of the position angles of ![]() (green in thetop and red in the bottom), θfil
(black), and
(green in thetop and red in the bottom), θfil
(black), and ![]() (blue) along crests 3 (top) and 4 (bottom), from south to north. Only pixels along the crests are considered. The dotted horizontal lines show an angle of 90°. The vertical red line in the top panel is the position of source III (cf., Fig. 10). The horizontal black segments on the top right hand of the panels indicate the 14′′ (0.09 pc) beam size of the data.
(blue) along crests 3 (top) and 4 (bottom), from south to north. Only pixels along the crests are considered. The dotted horizontal lines show an angle of 90°. The vertical red line in the top panel is the position of source III (cf., Fig. 10). The horizontal black segments on the top right hand of the panels indicate the 14′′ (0.09 pc) beam size of the data.
Current usage metrics show cumulative count of Article Views (full-text article views including HTML views, PDF and ePub downloads, according to the available data) and Abstracts Views on Vision4Press platform.
Data correspond to usage on the plateform after 2015. The current usage metrics is available 48-96 hours after online publication and is updated daily on week days.
Initial download of the metrics may take a while.