Fig. 11
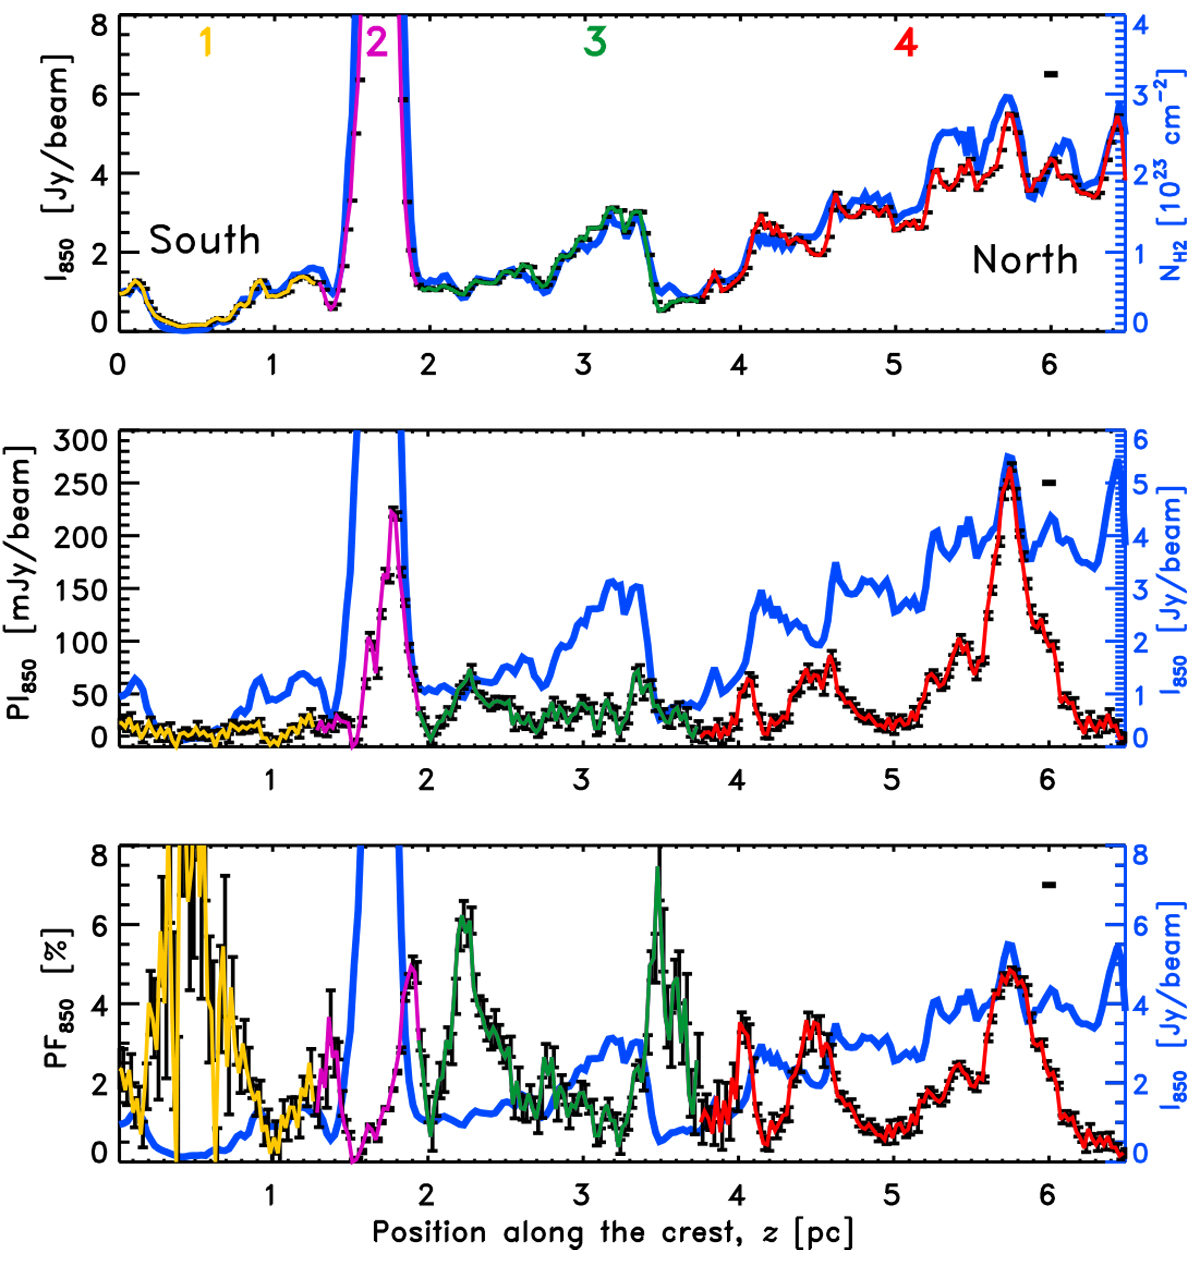
Observed I (top), PI (middle), and PF (bottom) along the ridge crest for the sections from 1 to 4 (indicated with different colors, see Fig. 10) from south to north (left to right on the horizontal axes). The short vertical black bars show the ± σ statistical uncertainties. The horizontal black segments on the top right hand of the panels indicate the 14′′ (0.09 pc) beam size of the data. The blue curve on the top panel is the column density derived from SPIRE+ArTéMiS data after subtraction of a constant “Galactic emission” value of 3 × 1022 cm−2 (cf. Sect. 2.3). The blue curves on the middle and bottom panels show I along the ridge crest (same as the colored curve on the top panel).
Current usage metrics show cumulative count of Article Views (full-text article views including HTML views, PDF and ePub downloads, according to the available data) and Abstracts Views on Vision4Press platform.
Data correspond to usage on the plateform after 2015. The current usage metrics is available 48-96 hours after online publication and is updated daily on week days.
Initial download of the metrics may take a while.