Fig. 1
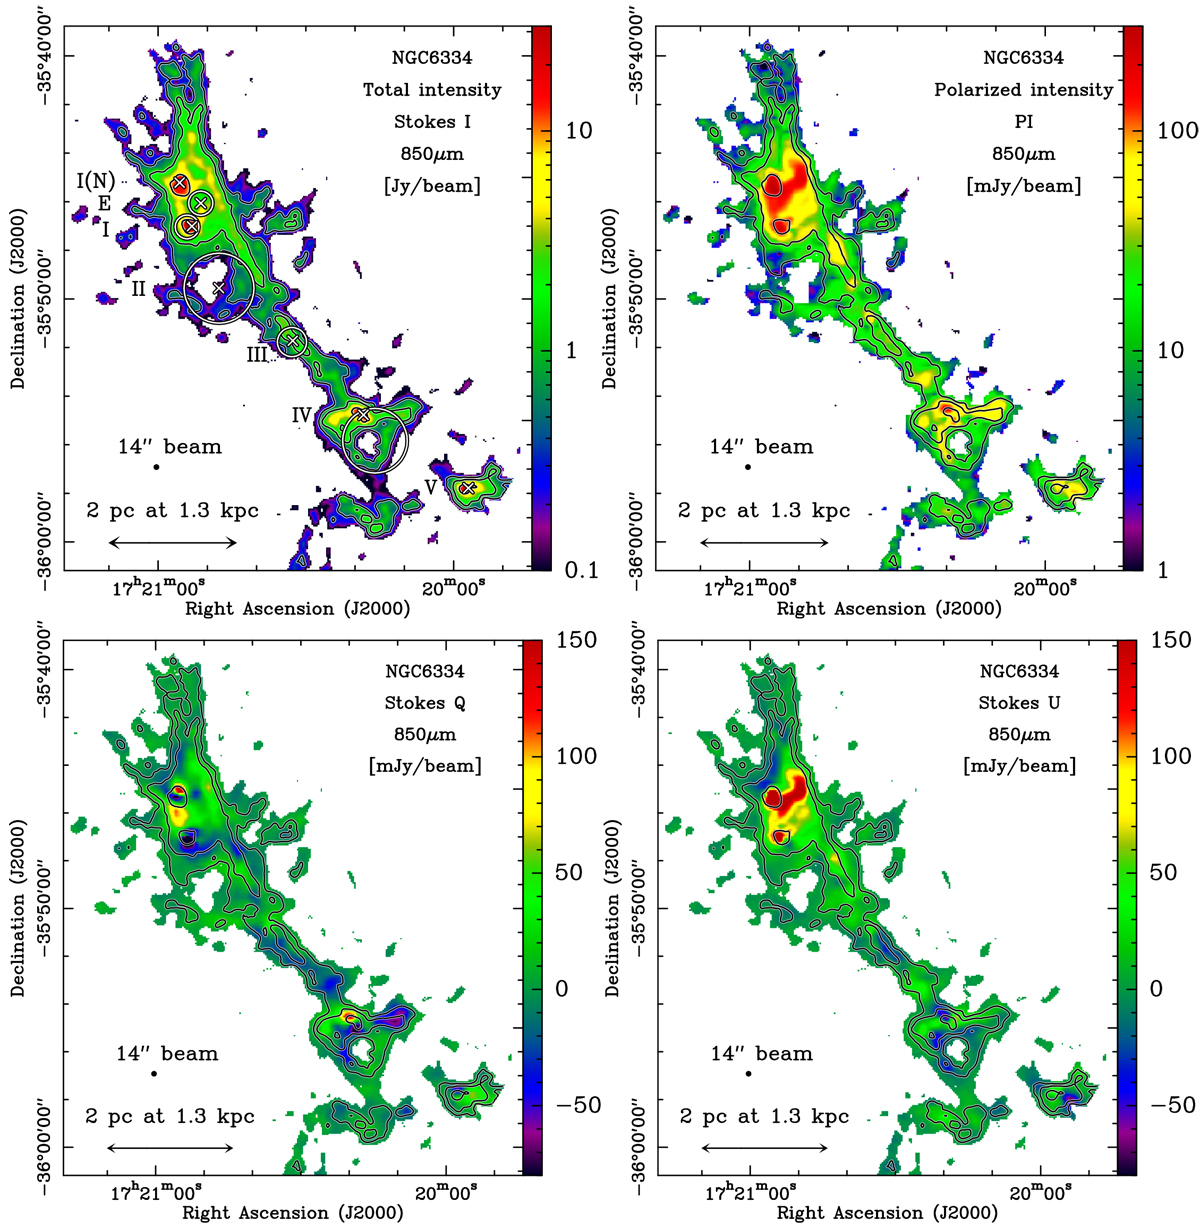
Stokes parameter maps of the total I (top-left) and the polarized Q and U (bottom-left and -right, respectively) thermal dust emission at 850 μm observed with the JCMT SCUBA-2/POL-2 toward NGC 6334 as part of the BISTRO survey. Top right hand side panel: map of the (debiased) polarized emission, PI. The half-power-beam-width (HPBW) resolution of these maps is 14′′. For all maps,the plotted emission corresponds to SNR(I) > 25. The contours, which are the same for all plots, correspond to I = 0.4, 1.4, and 8 Jy beam−1
or ![]() and 37) × 1022 cm−2. The lowest contour of I = 0.4 Jy beam−1
is equivalent to SNR(I) ~ 300 and SNR(PI) ~ 10. The white crosses on the I
map indicate the seven high-mass star-forming regions numbered from I to V from north to south in addition to I(N) and E in the north of the field. The white circles show the positions and sizes of UCH II and H II regions (see Persi & Tapia 2008,and references therein).
and 37) × 1022 cm−2. The lowest contour of I = 0.4 Jy beam−1
is equivalent to SNR(I) ~ 300 and SNR(PI) ~ 10. The white crosses on the I
map indicate the seven high-mass star-forming regions numbered from I to V from north to south in addition to I(N) and E in the north of the field. The white circles show the positions and sizes of UCH II and H II regions (see Persi & Tapia 2008,and references therein).
Current usage metrics show cumulative count of Article Views (full-text article views including HTML views, PDF and ePub downloads, according to the available data) and Abstracts Views on Vision4Press platform.
Data correspond to usage on the plateform after 2015. The current usage metrics is available 48-96 hours after online publication and is updated daily on week days.
Initial download of the metrics may take a while.