Fig. B.1.
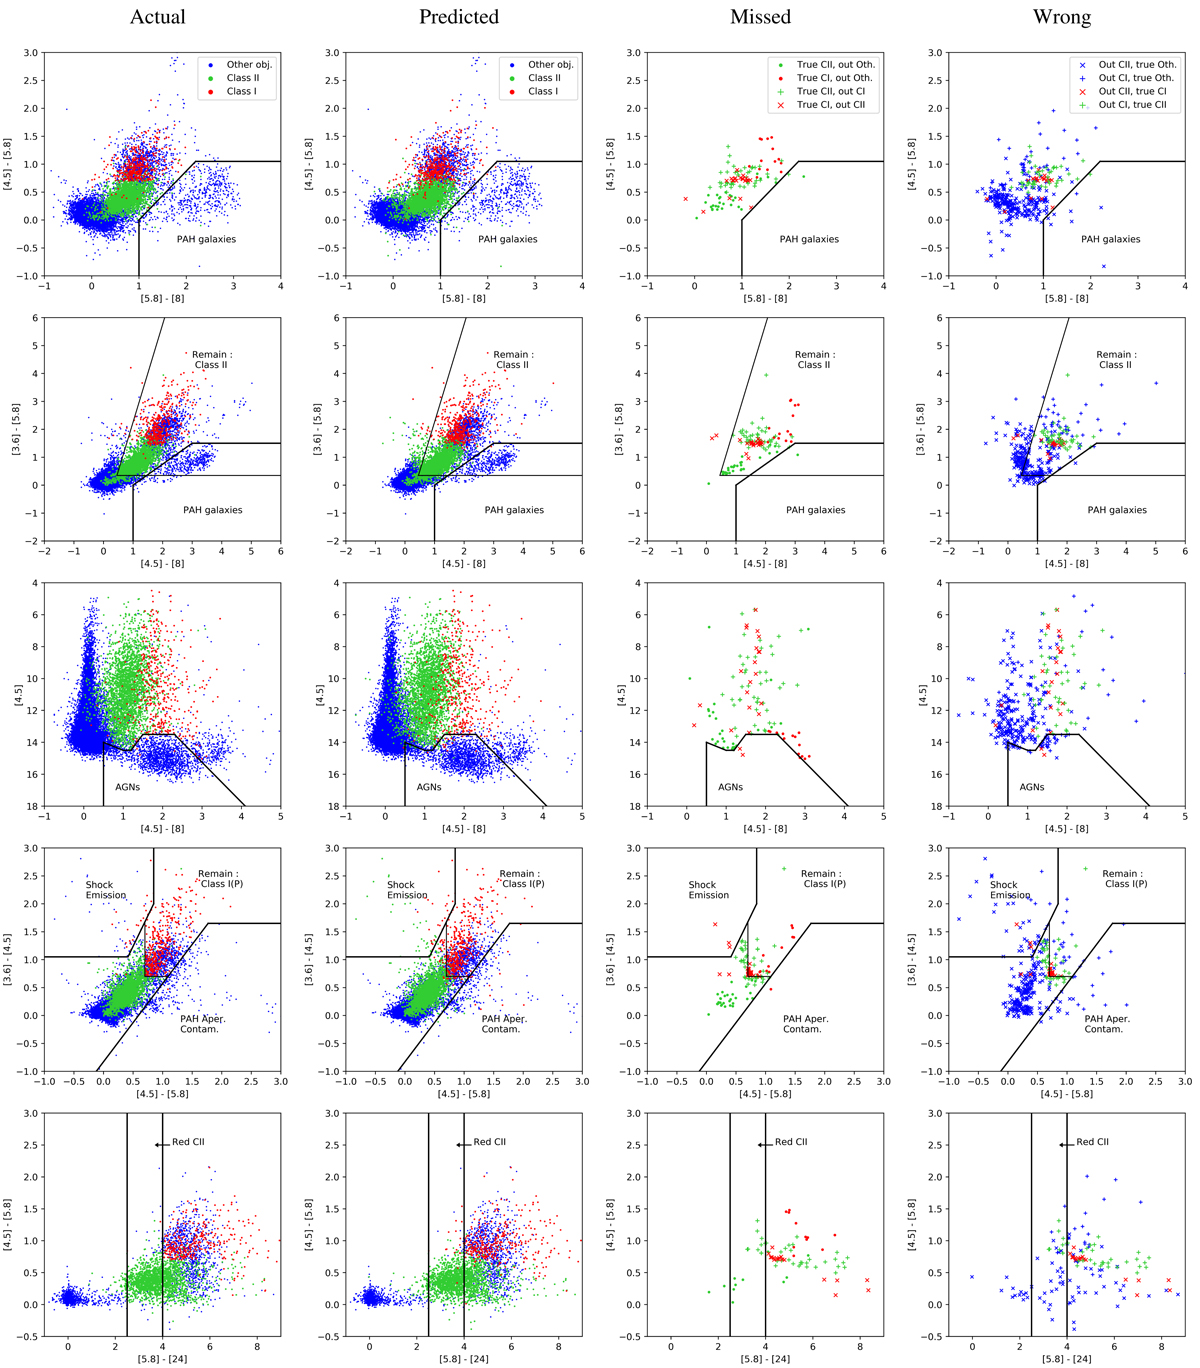
Input parameter space coverage in the CMDs used for the G09 method in the F–C case on the full dataset regarding different populations. Actual: Distribution of genuine classes. CI YSOs are in red, CII YSOs are in green, and Others are in blue. Predicted: Prediction given by the network with the same color-coding as for the actual frames. Missed: Genuine CI and CII according to the labeled dataset that were misclassified by the network. Green is for genuine CII YSOs, red for genuine CI YSOs. The points and crosses indicate the network output as specified in the legend. Wrong: YSO predictions of the network that are known to be incorrect based on the labeled dataset. Green is for genuine CII YSOs, red for genuine CI YSOs, and blue for genuine contaminants. The two types of crosses indicate the predicted YSO class as specified in the legend.
Current usage metrics show cumulative count of Article Views (full-text article views including HTML views, PDF and ePub downloads, according to the available data) and Abstracts Views on Vision4Press platform.
Data correspond to usage on the plateform after 2015. The current usage metrics is available 48-96 hours after online publication and is updated daily on week days.
Initial download of the metrics may take a while.