Open Access
Fig. A.1.
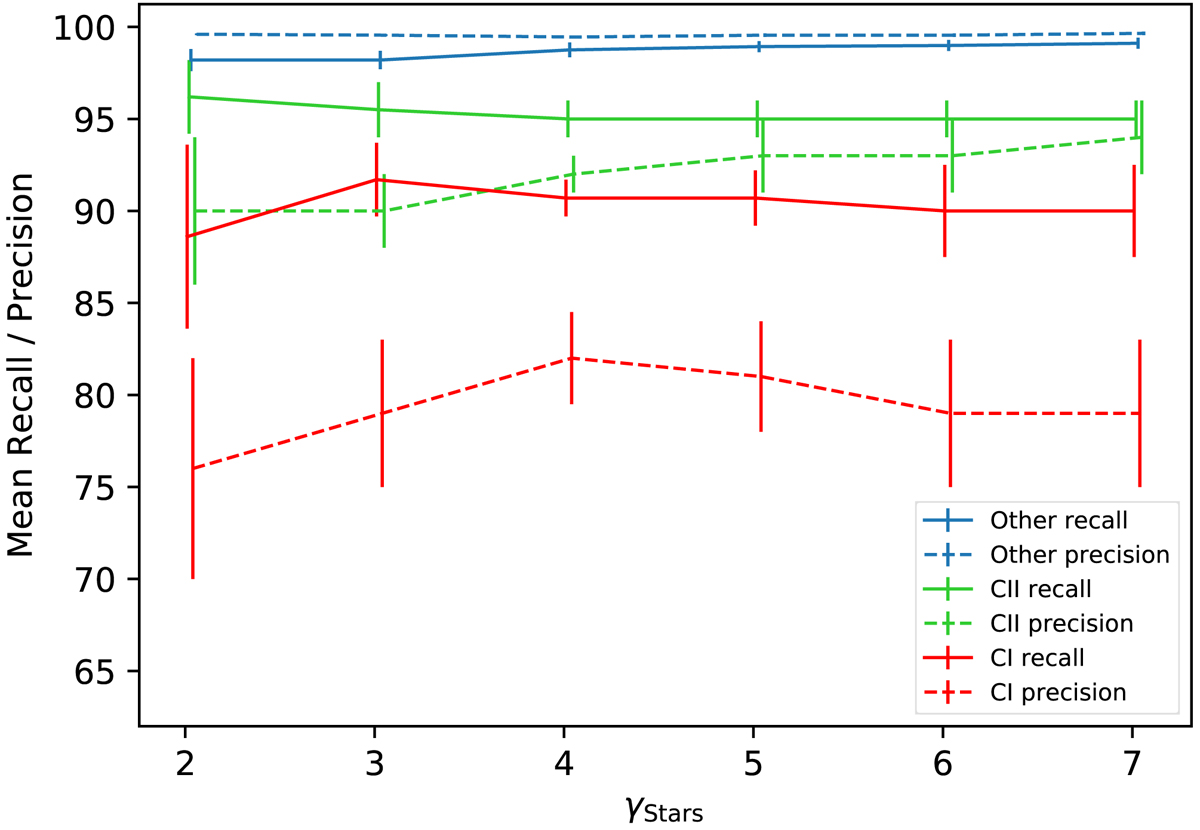
Quality indicators for each network output class as a function of the proportion of stars in the training sample γStars. The lines are the recall (continuous) and the precision (dashed) mean value of convergence over ten trainings, and the error bars represent the typical ranges of convergence value.
Current usage metrics show cumulative count of Article Views (full-text article views including HTML views, PDF and ePub downloads, according to the available data) and Abstracts Views on Vision4Press platform.
Data correspond to usage on the plateform after 2015. The current usage metrics is available 48-96 hours after online publication and is updated daily on week days.
Initial download of the metrics may take a while.