Fig. 4.
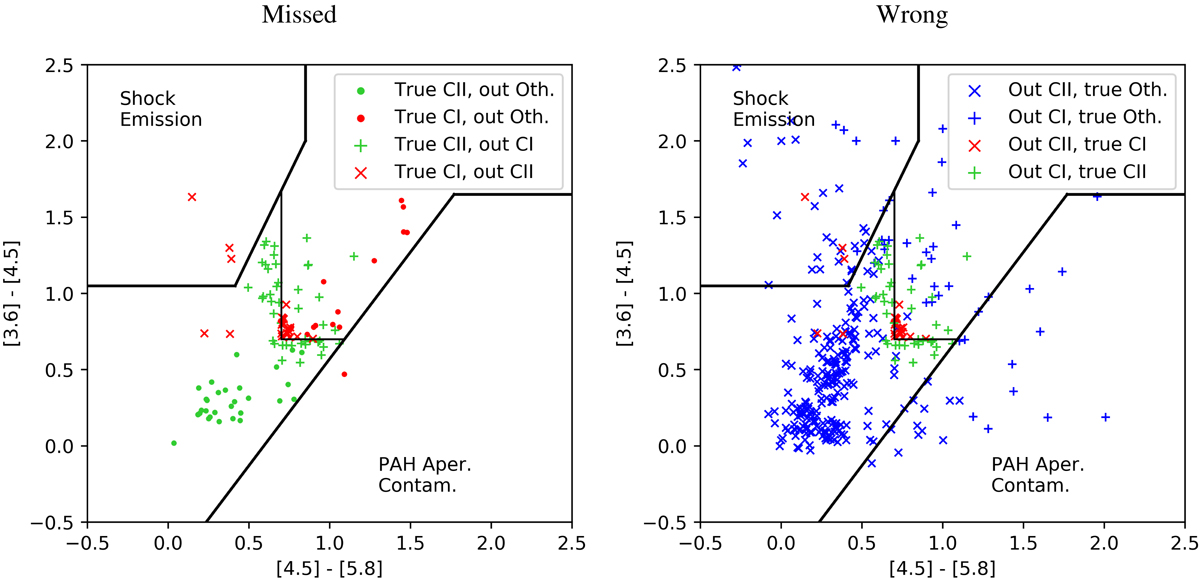
Zoom-in on the [4.5]−[5.8] vs. [3.6]−[4.5] graph, for misclassified objects in the F–C case. Missed: Genuine CI and CII YSOs according to the labeled dataset that were misclassified by the network. Wrong: Predictions of the network that are known to be incorrect based on the labeled dataset. In both frames, green is for genuine CII YSOs, red for genuine CI YSOs, and blue is for genuine contaminants. The symbol shapes indicate the predicted output class as specified in the legends.
Current usage metrics show cumulative count of Article Views (full-text article views including HTML views, PDF and ePub downloads, according to the available data) and Abstracts Views on Vision4Press platform.
Data correspond to usage on the plateform after 2015. The current usage metrics is available 48-96 hours after online publication and is updated daily on week days.
Initial download of the metrics may take a while.