Fig. 2.
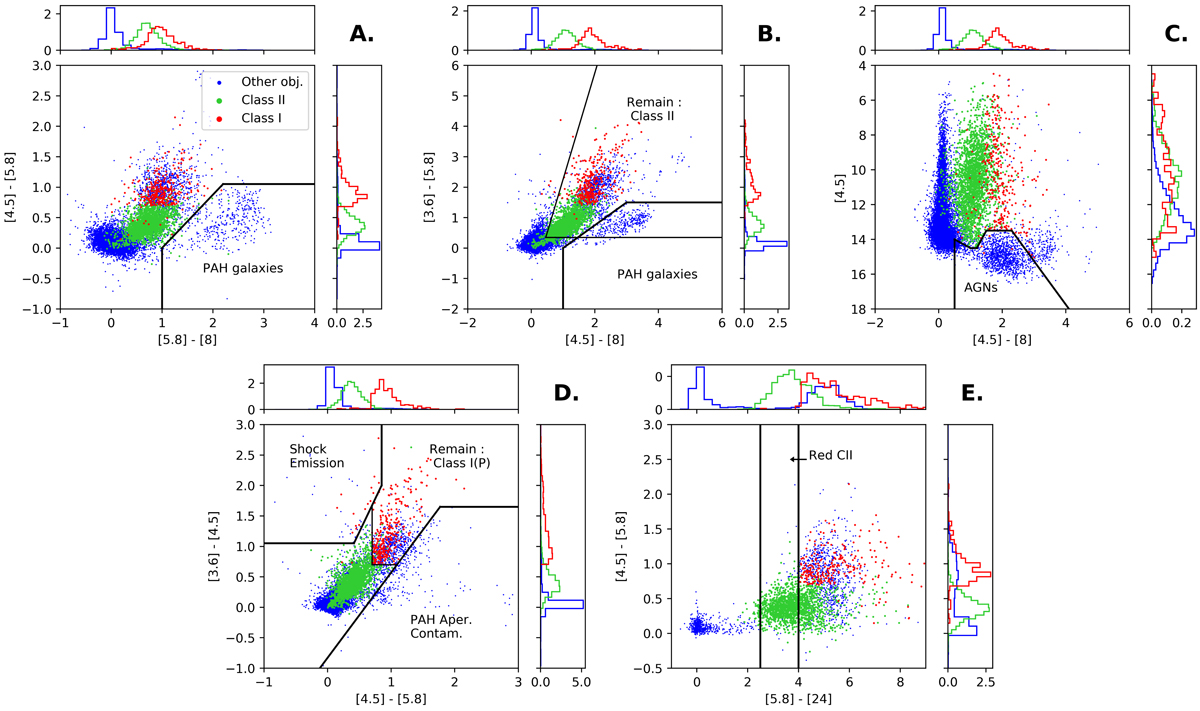
Selection of color-color and color-magnitude diagrams from our simplified multistep G09 classification. The data used in this figure correspond to the Orion labeled dataset in Table 1. The contaminants, CII YSOs, and CI YSOs are shown in blue, green, and red, respectively. They are plotted in that order and partly screen one another, as revealed by the histograms in the side frames. The area of each histogram is normalized to one. In frame A, some PAH galaxies are excluded. In frame B, leftover PAH galaxies are excluded based on other criteria. It also shows the criteria of class II extraction that is in a later step. In frame C, AGNs are excluded. In frame D, Shocks and PAH aperture contaminants are excluded. It also shows the last criteria of class I extraction. In frame D, one of the criteria from the Multiband Imaging Photometer (MIPS) 24 μm band is shown, which identifies reddened Class II in the previously classified Class I.
Current usage metrics show cumulative count of Article Views (full-text article views including HTML views, PDF and ePub downloads, according to the available data) and Abstracts Views on Vision4Press platform.
Data correspond to usage on the plateform after 2015. The current usage metrics is available 48-96 hours after online publication and is updated daily on week days.
Initial download of the metrics may take a while.