Fig. 5.
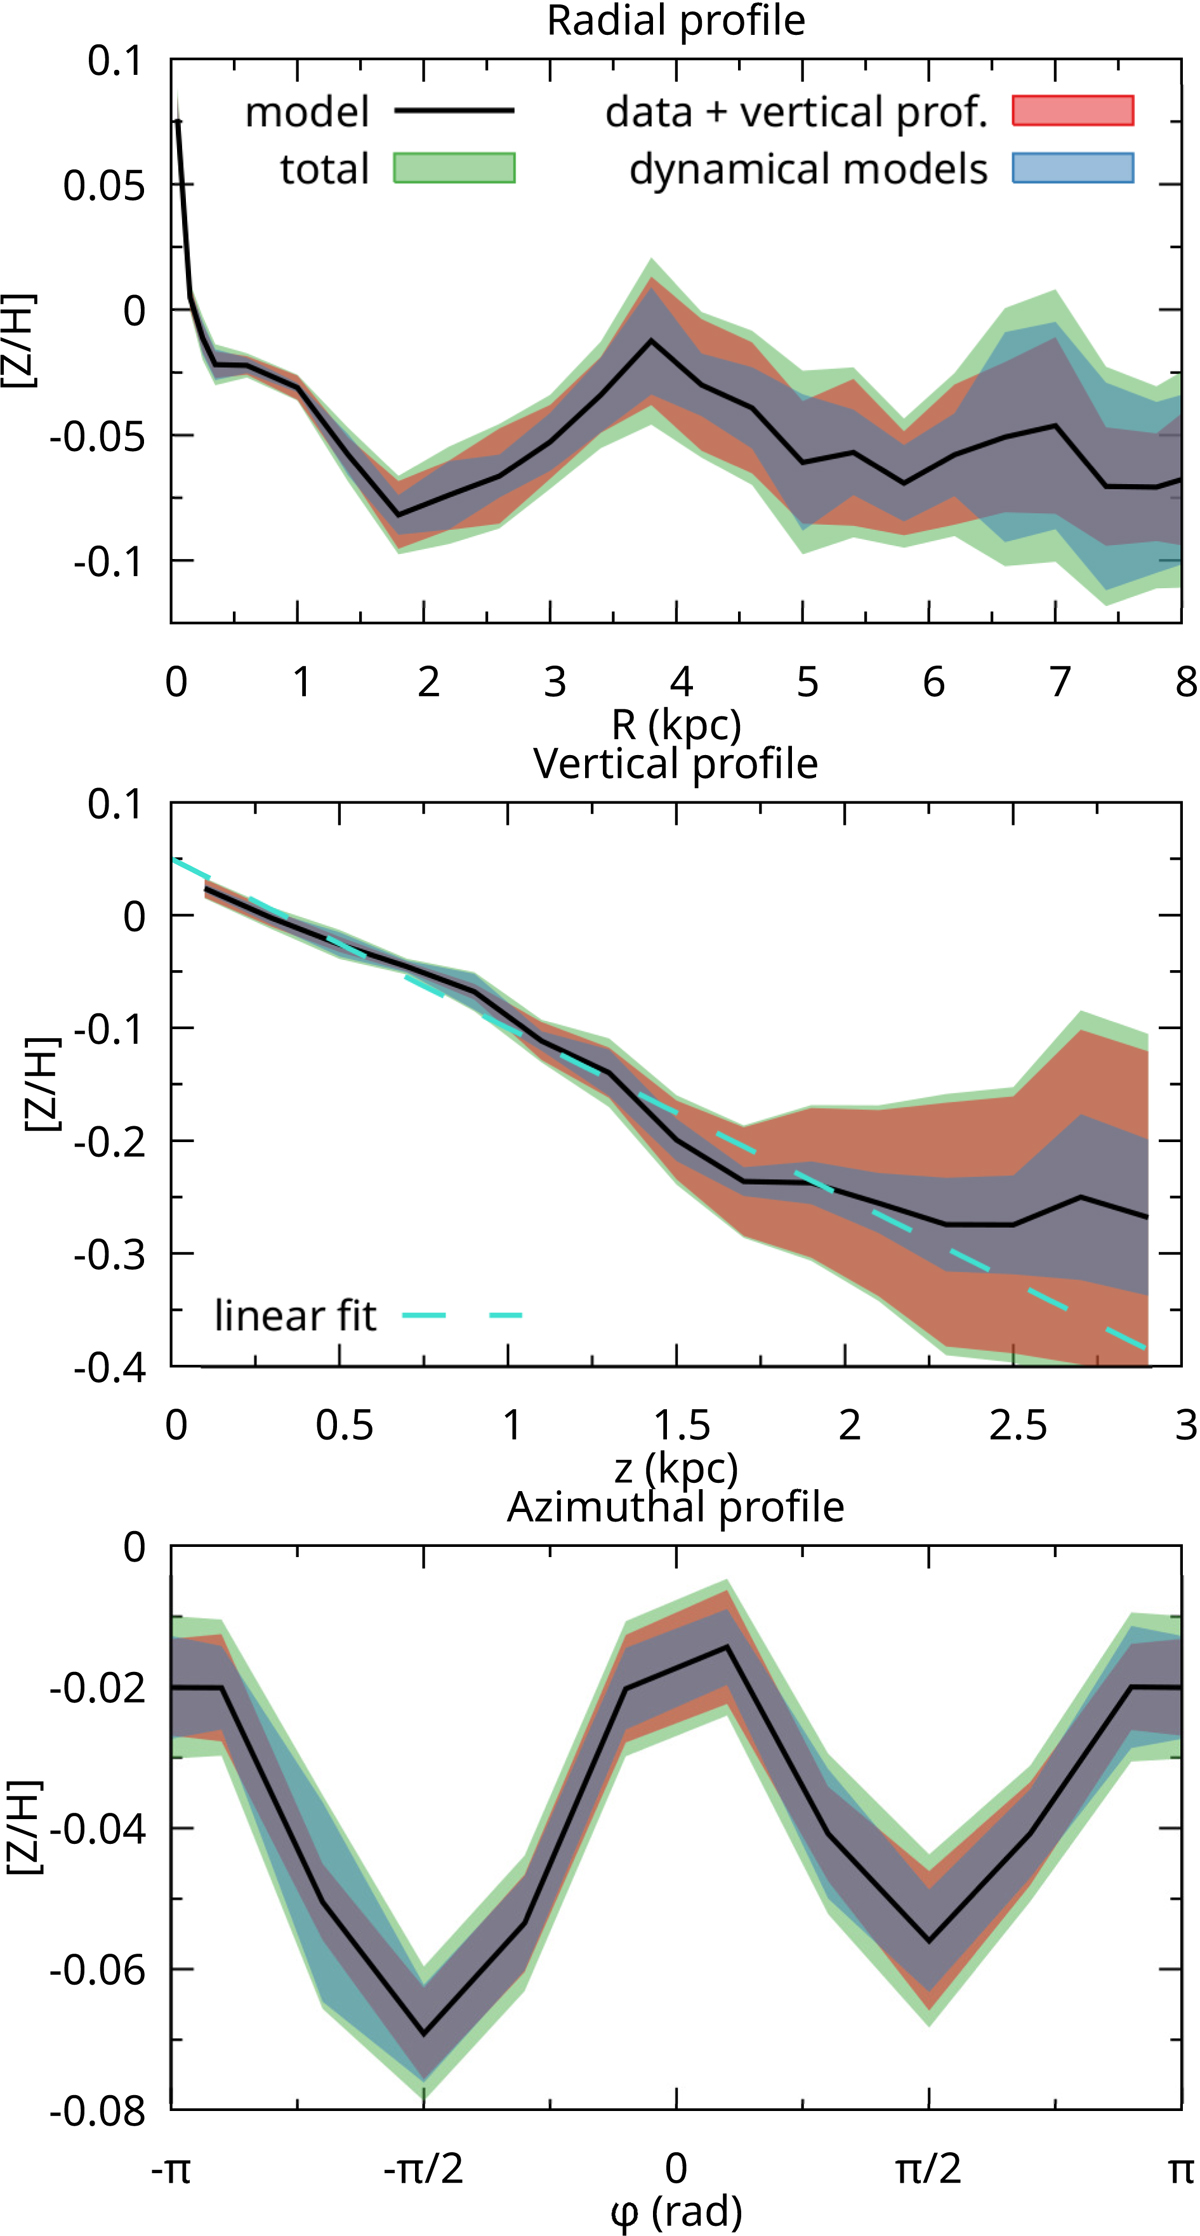
Metallicity profiles calculated from the best model. From top to bottom: radial profile (as a function of the cylindrical radius), the vertical profile, and the azimuthal profile (black lines). The coloured bands show the different uncertainties. In red we mark the sum of the errors stemming from the uncertainties in the data and the vertical profiles, in blue we show the error range resulting from the uncertainty of the underlying dynamical model, and the green bands mark our final uncertainty estimates, which are the sum (in quadrature) of the three. We note that overlapping red, blue, and green appears as grey, and overlapping red and green as orange. Middle panel: the turquoise dashed line represents an uncertainty-weighted linear fit to the model curve.
Current usage metrics show cumulative count of Article Views (full-text article views including HTML views, PDF and ePub downloads, according to the available data) and Abstracts Views on Vision4Press platform.
Data correspond to usage on the plateform after 2015. The current usage metrics is available 48-96 hours after online publication and is updated daily on week days.
Initial download of the metrics may take a while.