Fig. 3.
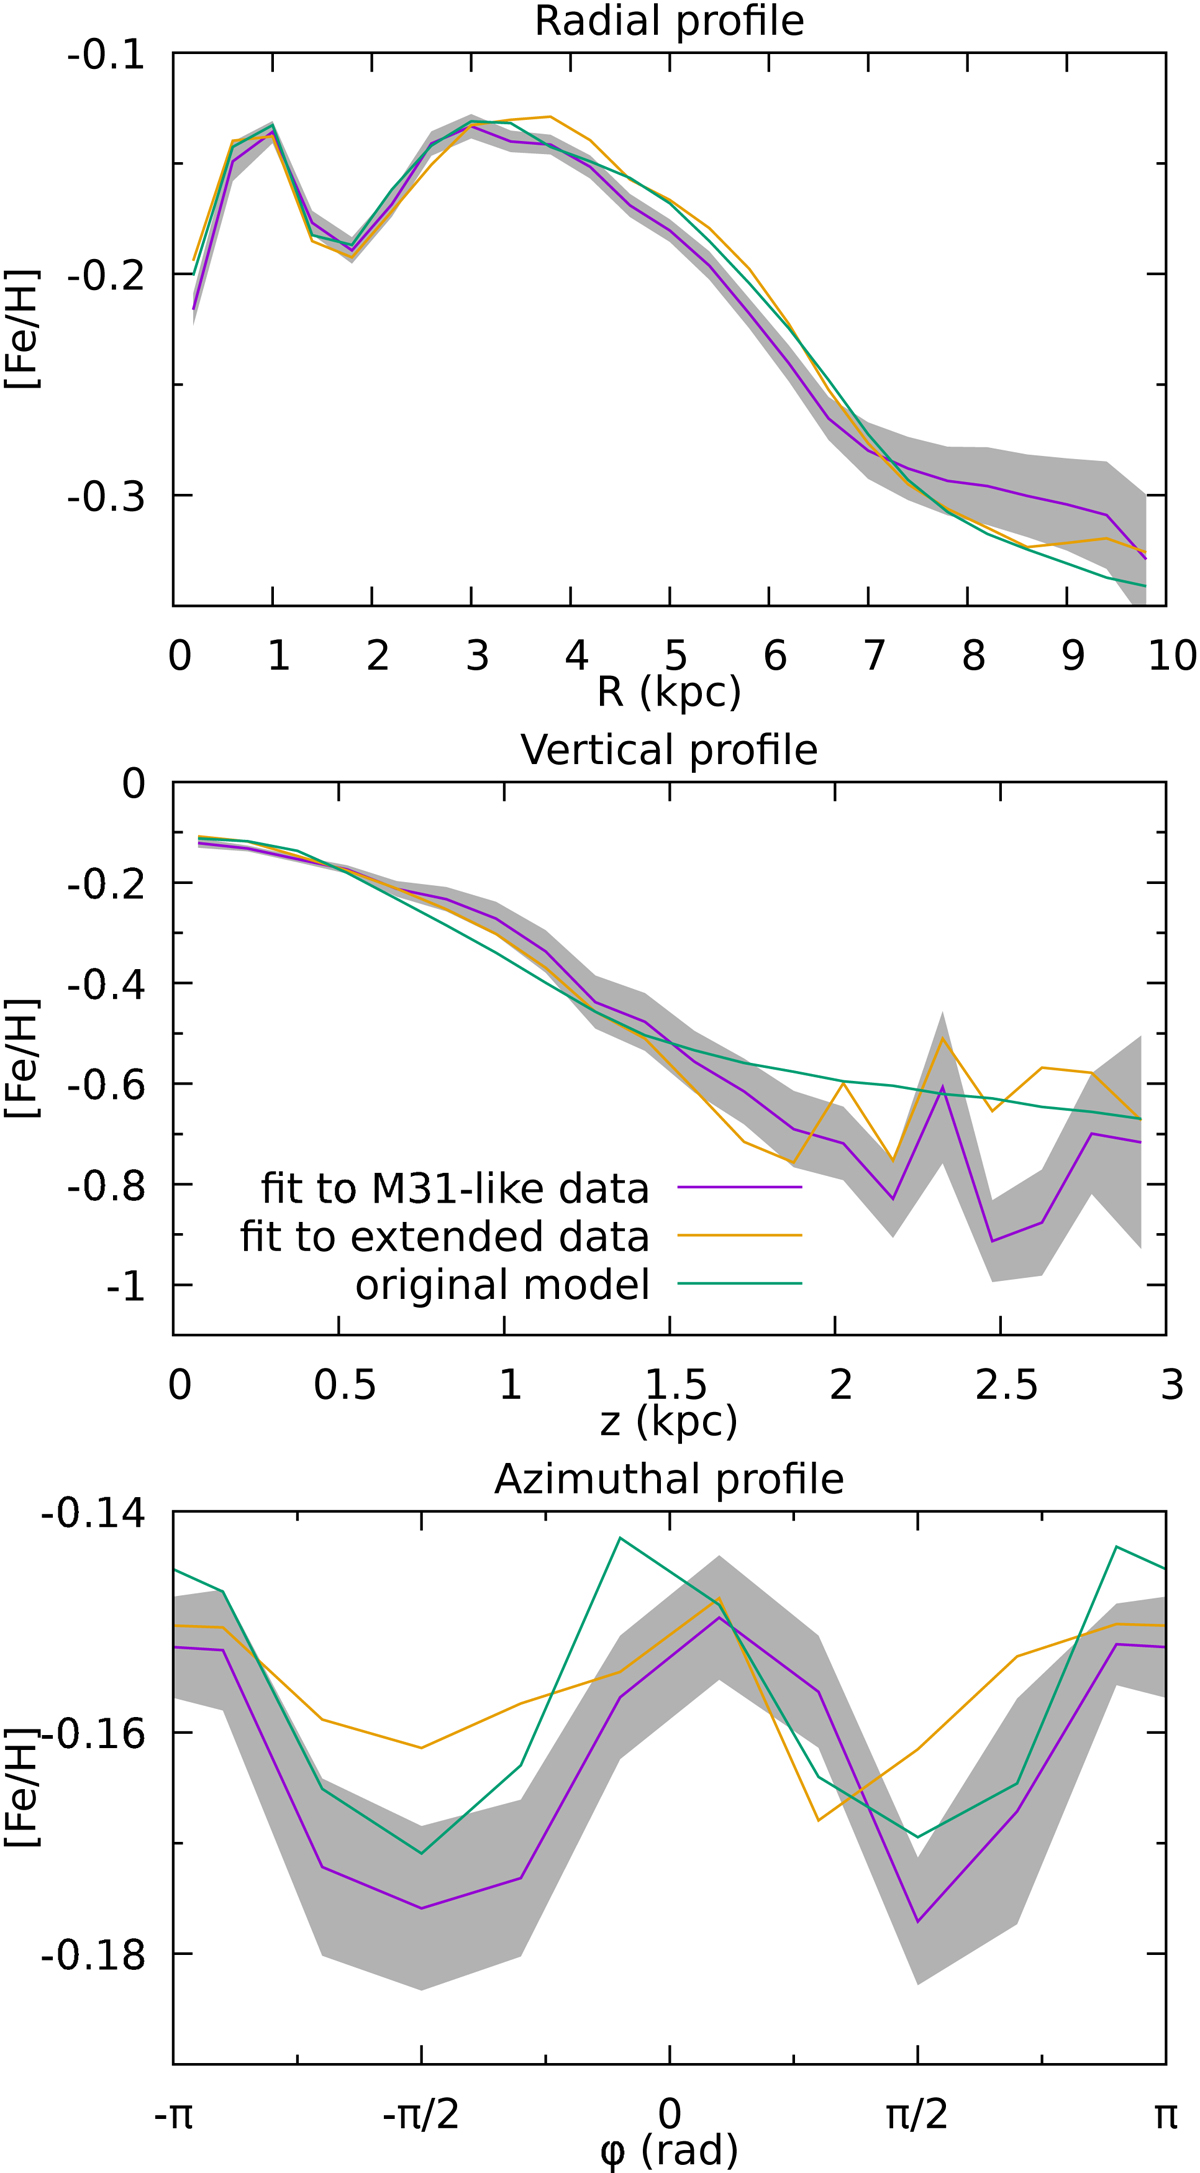
Metallicity profiles calculated from the model fitted to M 31-like mock data (violet, with a grey band of uncertainty), compared to profiles of the original model (green). The yellow lines show profiles resulting from a model fit to spatially-extended mock data. From top to bottom: radial profile (as a function of cylindrical radius), vertical profile, and azimuthal profile.
Current usage metrics show cumulative count of Article Views (full-text article views including HTML views, PDF and ePub downloads, according to the available data) and Abstracts Views on Vision4Press platform.
Data correspond to usage on the plateform after 2015. The current usage metrics is available 48-96 hours after online publication and is updated daily on week days.
Initial download of the metrics may take a while.