Open Access
Fig. 2.
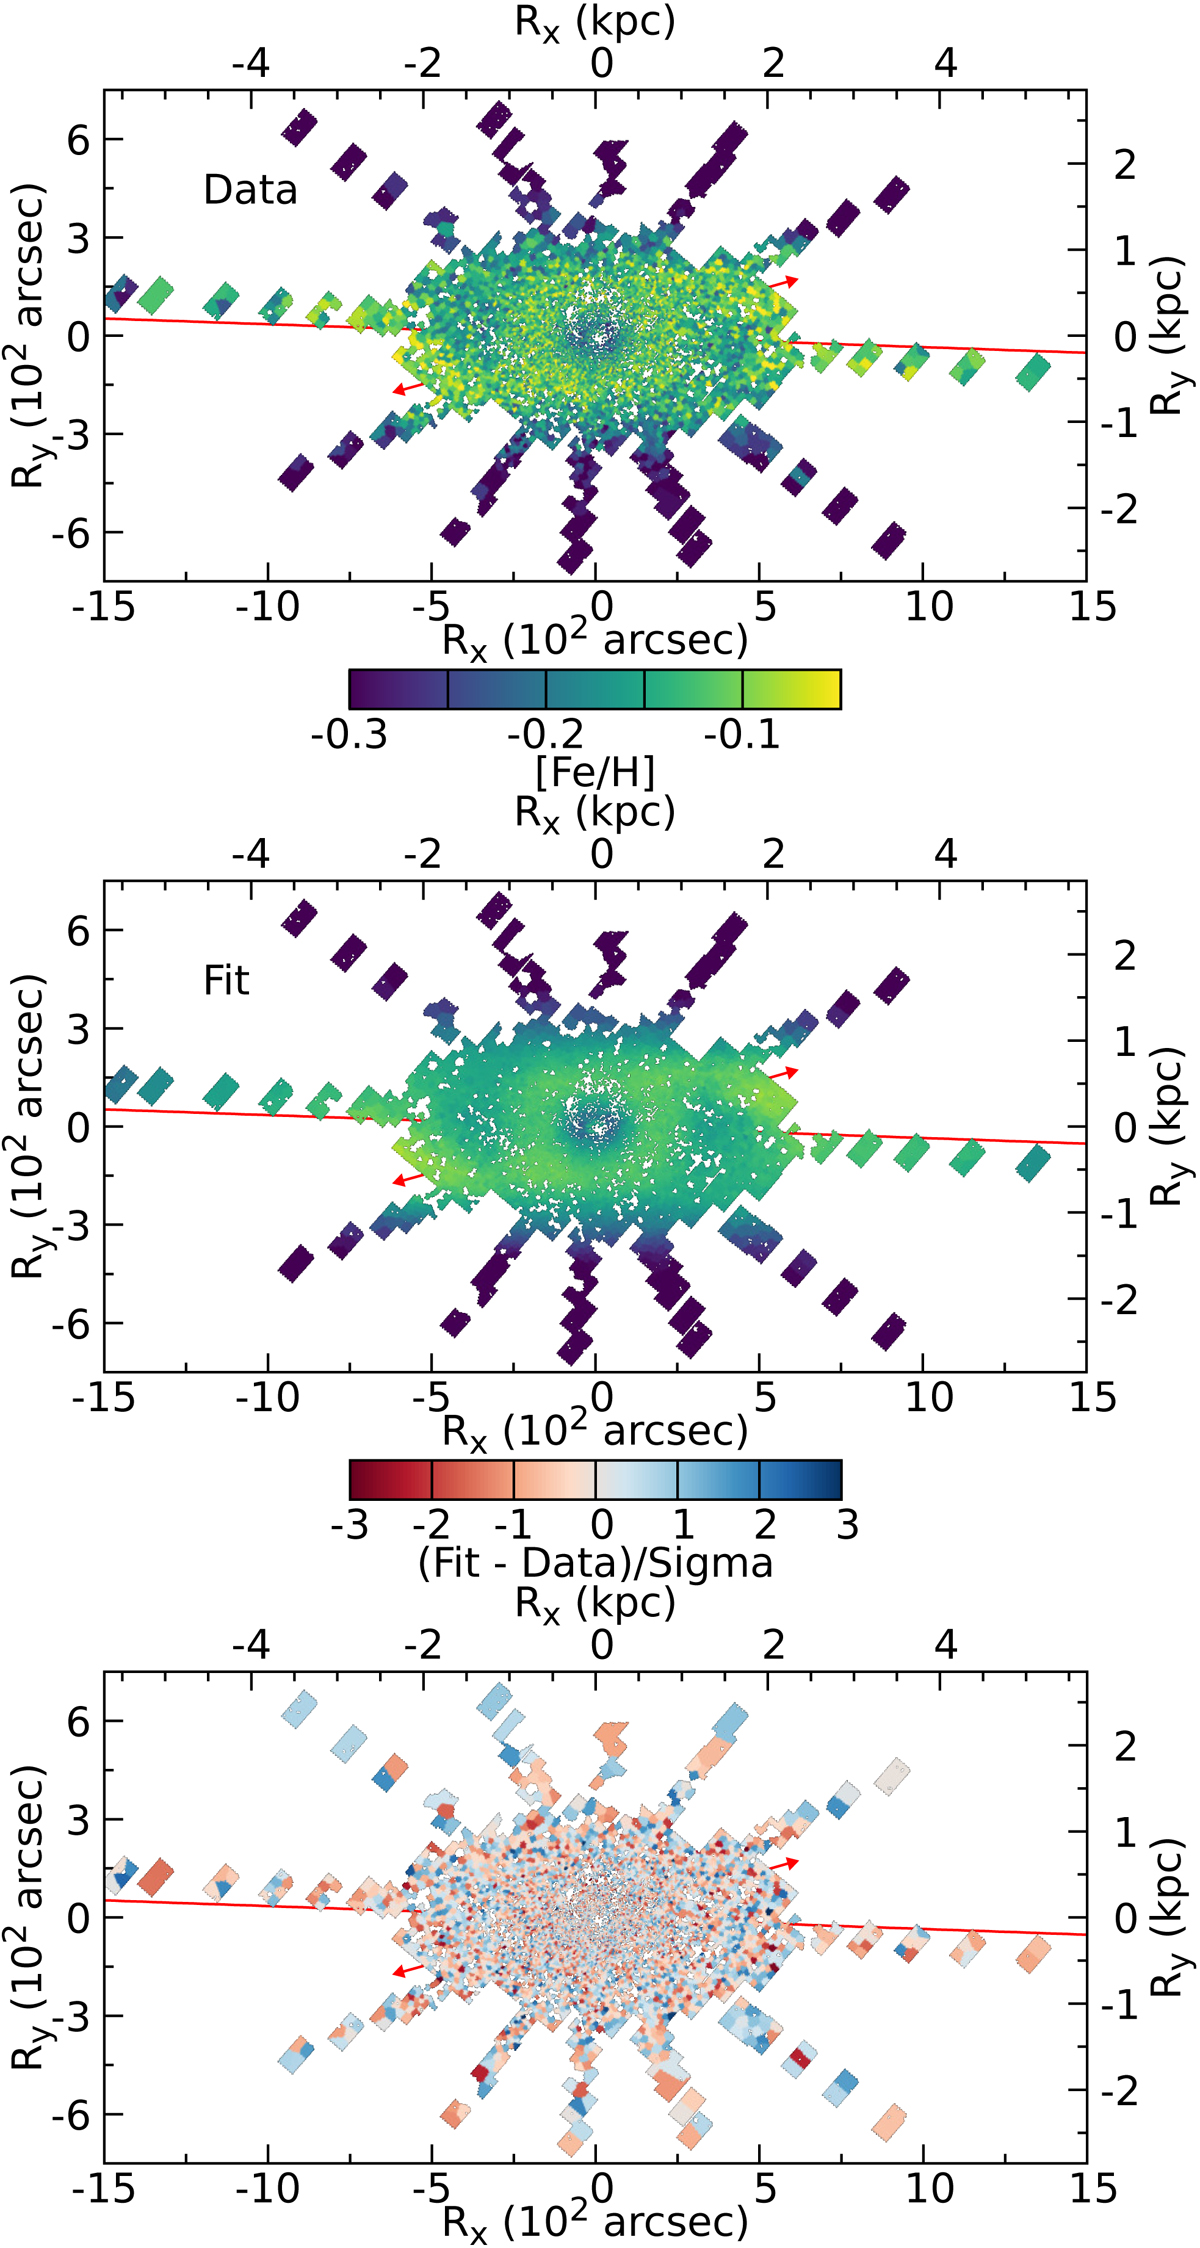
Comparison of the model fit to the mock data. Top: mock map of mean [Fe/H] with a noise of σ[Fe/H] = 0.04 dex. Middle: best M2M dynamical model. Bottom: standardised residuals. The solid red line marks the position angle of the projected disc major axis, while the red arrows mark the orientation and the extent of the bar.
Current usage metrics show cumulative count of Article Views (full-text article views including HTML views, PDF and ePub downloads, according to the available data) and Abstracts Views on Vision4Press platform.
Data correspond to usage on the plateform after 2015. The current usage metrics is available 48-96 hours after online publication and is updated daily on week days.
Initial download of the metrics may take a while.