Open Access
Fig. B.1.
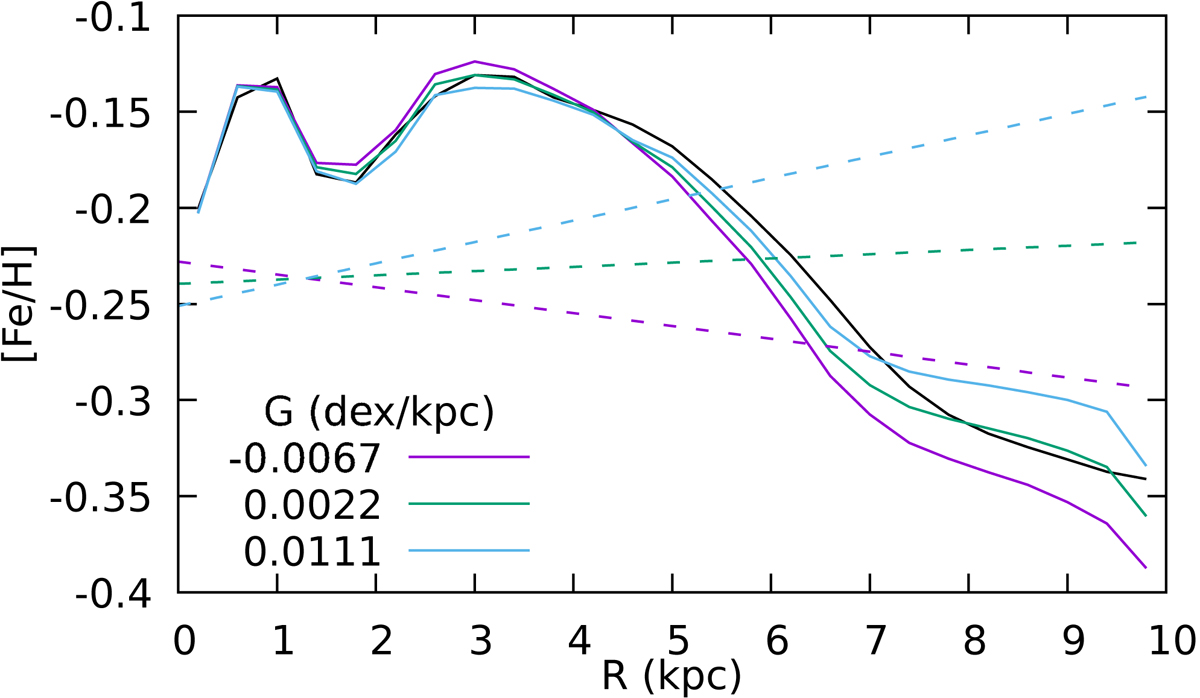
Initial (dashed lines) and final (solid lines) radial metallicity profiles of the mock galaxy. The green line marks the model with the lowest final χ2, while the blue and violet lines correspond to the 1σ-worse models. The black line shows the radial profile of the original mock galaxy.
Current usage metrics show cumulative count of Article Views (full-text article views including HTML views, PDF and ePub downloads, according to the available data) and Abstracts Views on Vision4Press platform.
Data correspond to usage on the plateform after 2015. The current usage metrics is available 48-96 hours after online publication and is updated daily on week days.
Initial download of the metrics may take a while.