Fig. A.1.
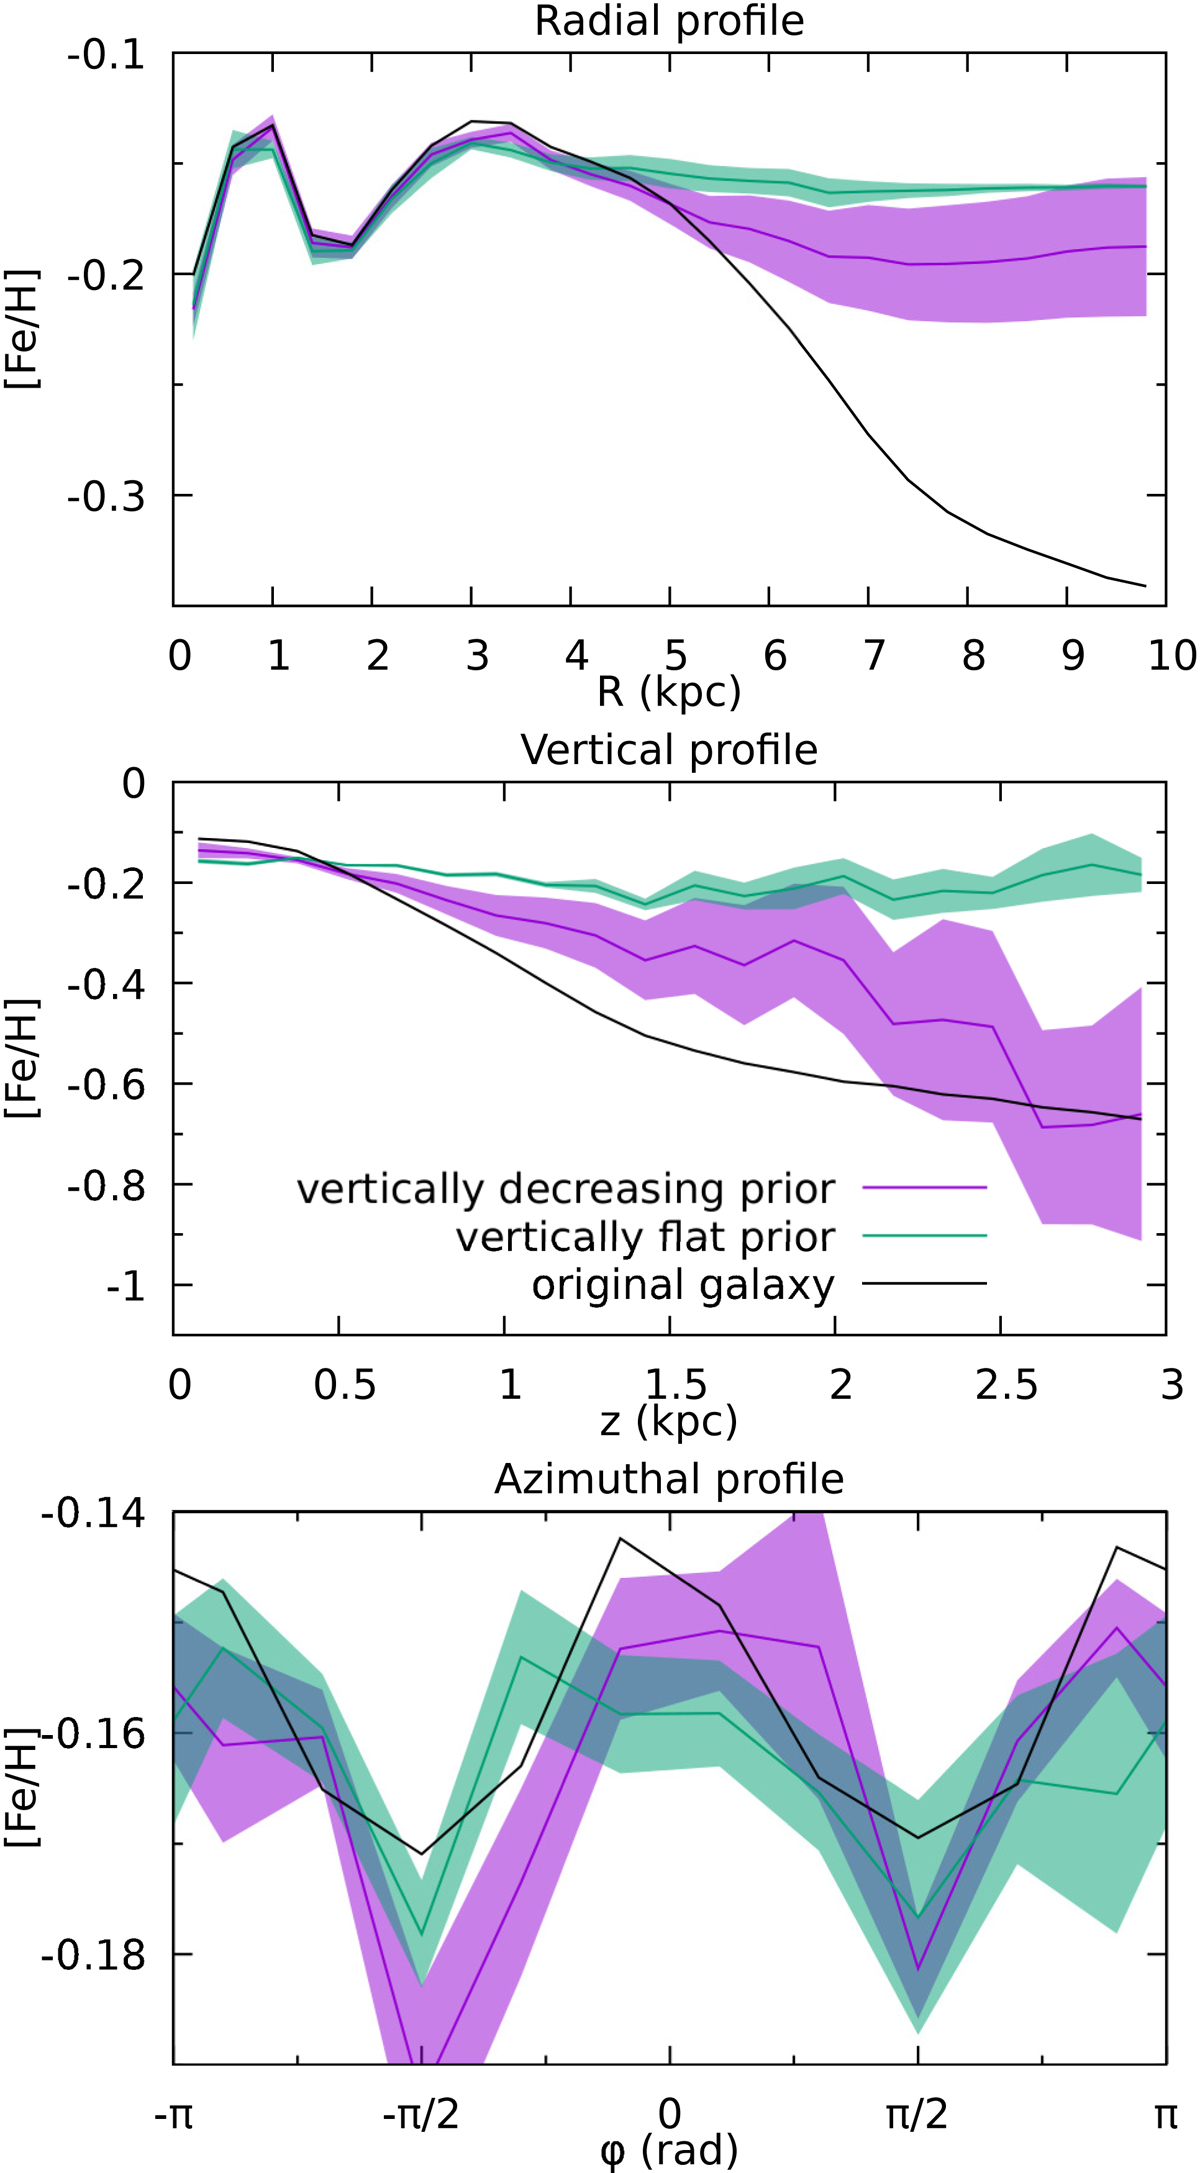
Profiles of [Fe/H] for the mock test for an inclination of 45°. From top to bottom: radial profiles (as a function of the cylindrical radius), vertical profiles, and azimuthal profiles. The green lines depict effects of the modelling assuming a flat vertical prior. The violet lines correspond to the optimal, vertically decreasing prior. Coloured bands show the respective uncertainties. The black lines shows the profiles of the target galaxy. We note that the data constrains extend only to R < 6 kpc.
Current usage metrics show cumulative count of Article Views (full-text article views including HTML views, PDF and ePub downloads, according to the available data) and Abstracts Views on Vision4Press platform.
Data correspond to usage on the plateform after 2015. The current usage metrics is available 48-96 hours after online publication and is updated daily on week days.
Initial download of the metrics may take a while.