Fig. 10.
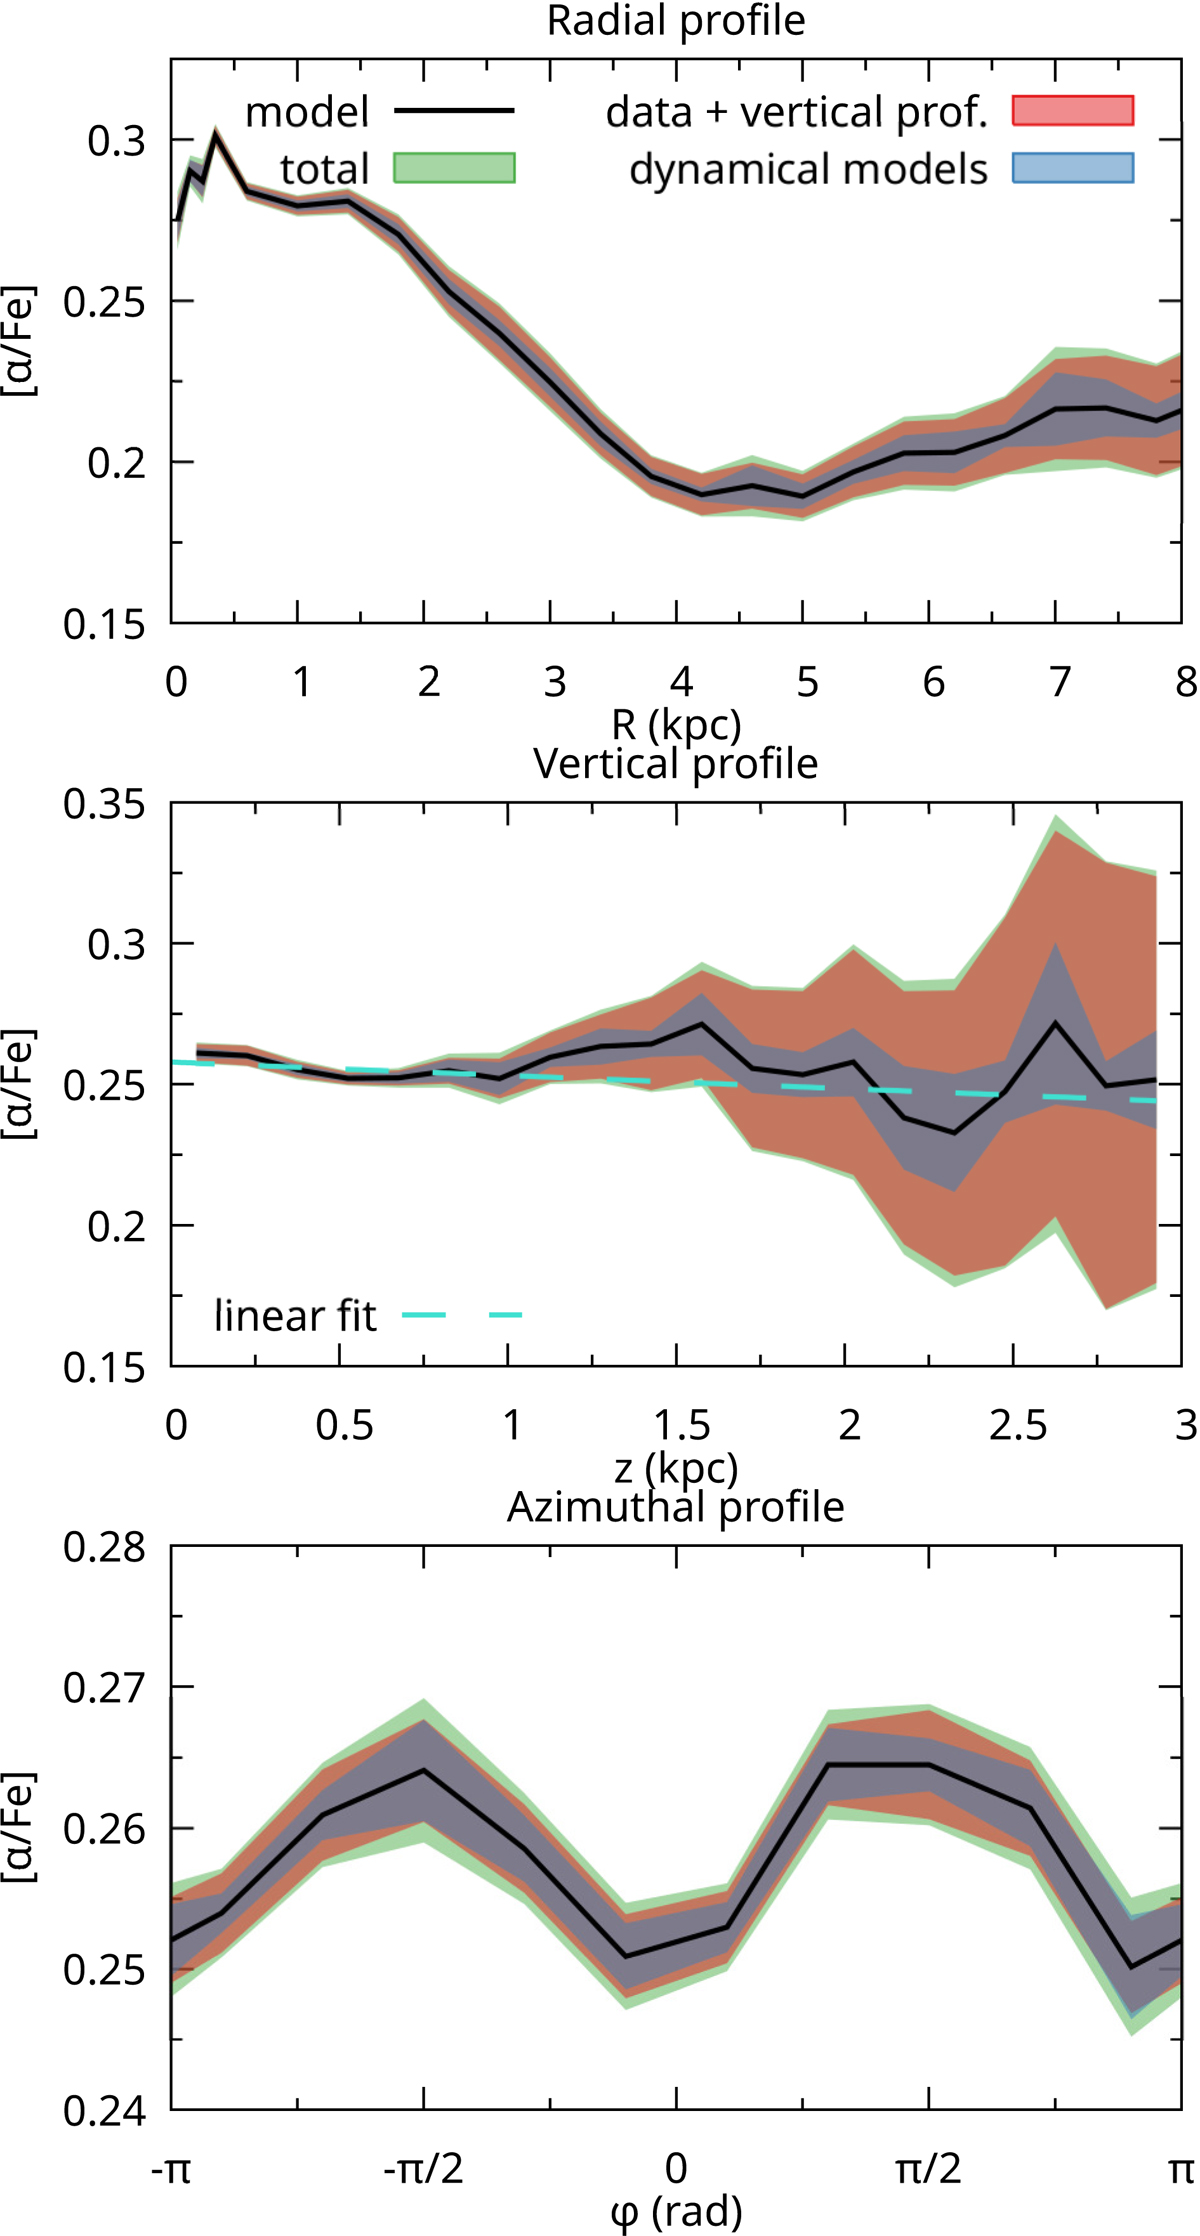
Profiles of the α-enhancement, calculated from the fitted model. From top to bottom: radial profile (as a function of the cylindrical radius), vertical profile, and the azimuthal profile. Coloured bands show the different uncertainties as in Fig. 5. Middle panel: the turquoise dashed line represents an uncertainty-weighted linear fit to the model curve.
Current usage metrics show cumulative count of Article Views (full-text article views including HTML views, PDF and ePub downloads, according to the available data) and Abstracts Views on Vision4Press platform.
Data correspond to usage on the plateform after 2015. The current usage metrics is available 48-96 hours after online publication and is updated daily on week days.
Initial download of the metrics may take a while.