Fig. 1.
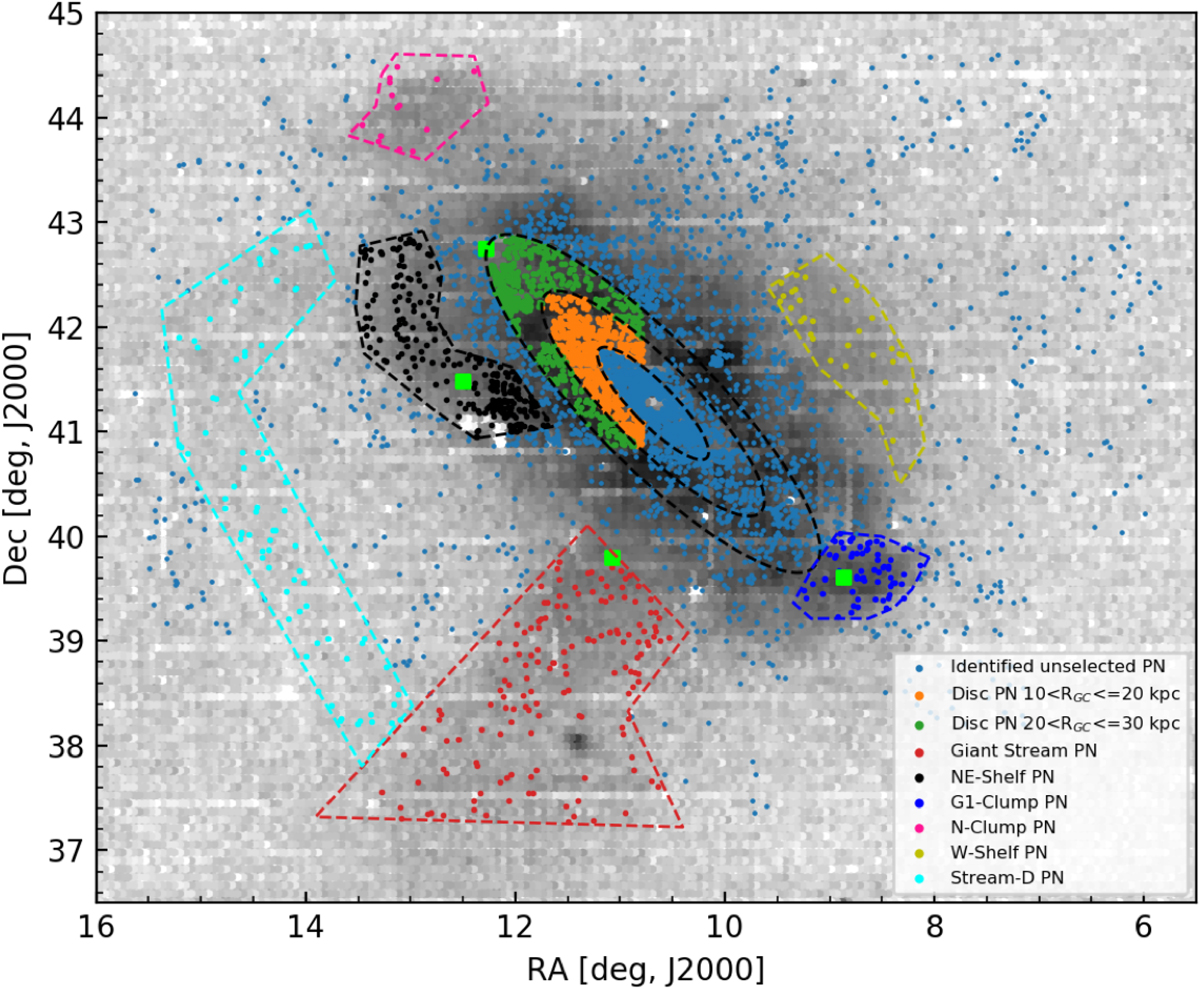
Position on the sky of PNe (all marked points) identified by Paper I and Bhattacharya et al. (in prep.). Positions are overlaid on the number density map of RGB stars from PAndAS (McConnachie et al. 2018), binned for visual clarity and shown in grey. The PNe selected for the PNLF analysis in the two disc regions and six substructure regions are marked with different colours. North is up, east is left. The HST fields observed by Bernard et al. (2015) to obtain the SFH of four of the M 31 regions have been marked with green squares.
Current usage metrics show cumulative count of Article Views (full-text article views including HTML views, PDF and ePub downloads, according to the available data) and Abstracts Views on Vision4Press platform.
Data correspond to usage on the plateform after 2015. The current usage metrics is available 48-96 hours after online publication and is updated daily on week days.
Initial download of the metrics may take a while.