Fig. B.4.
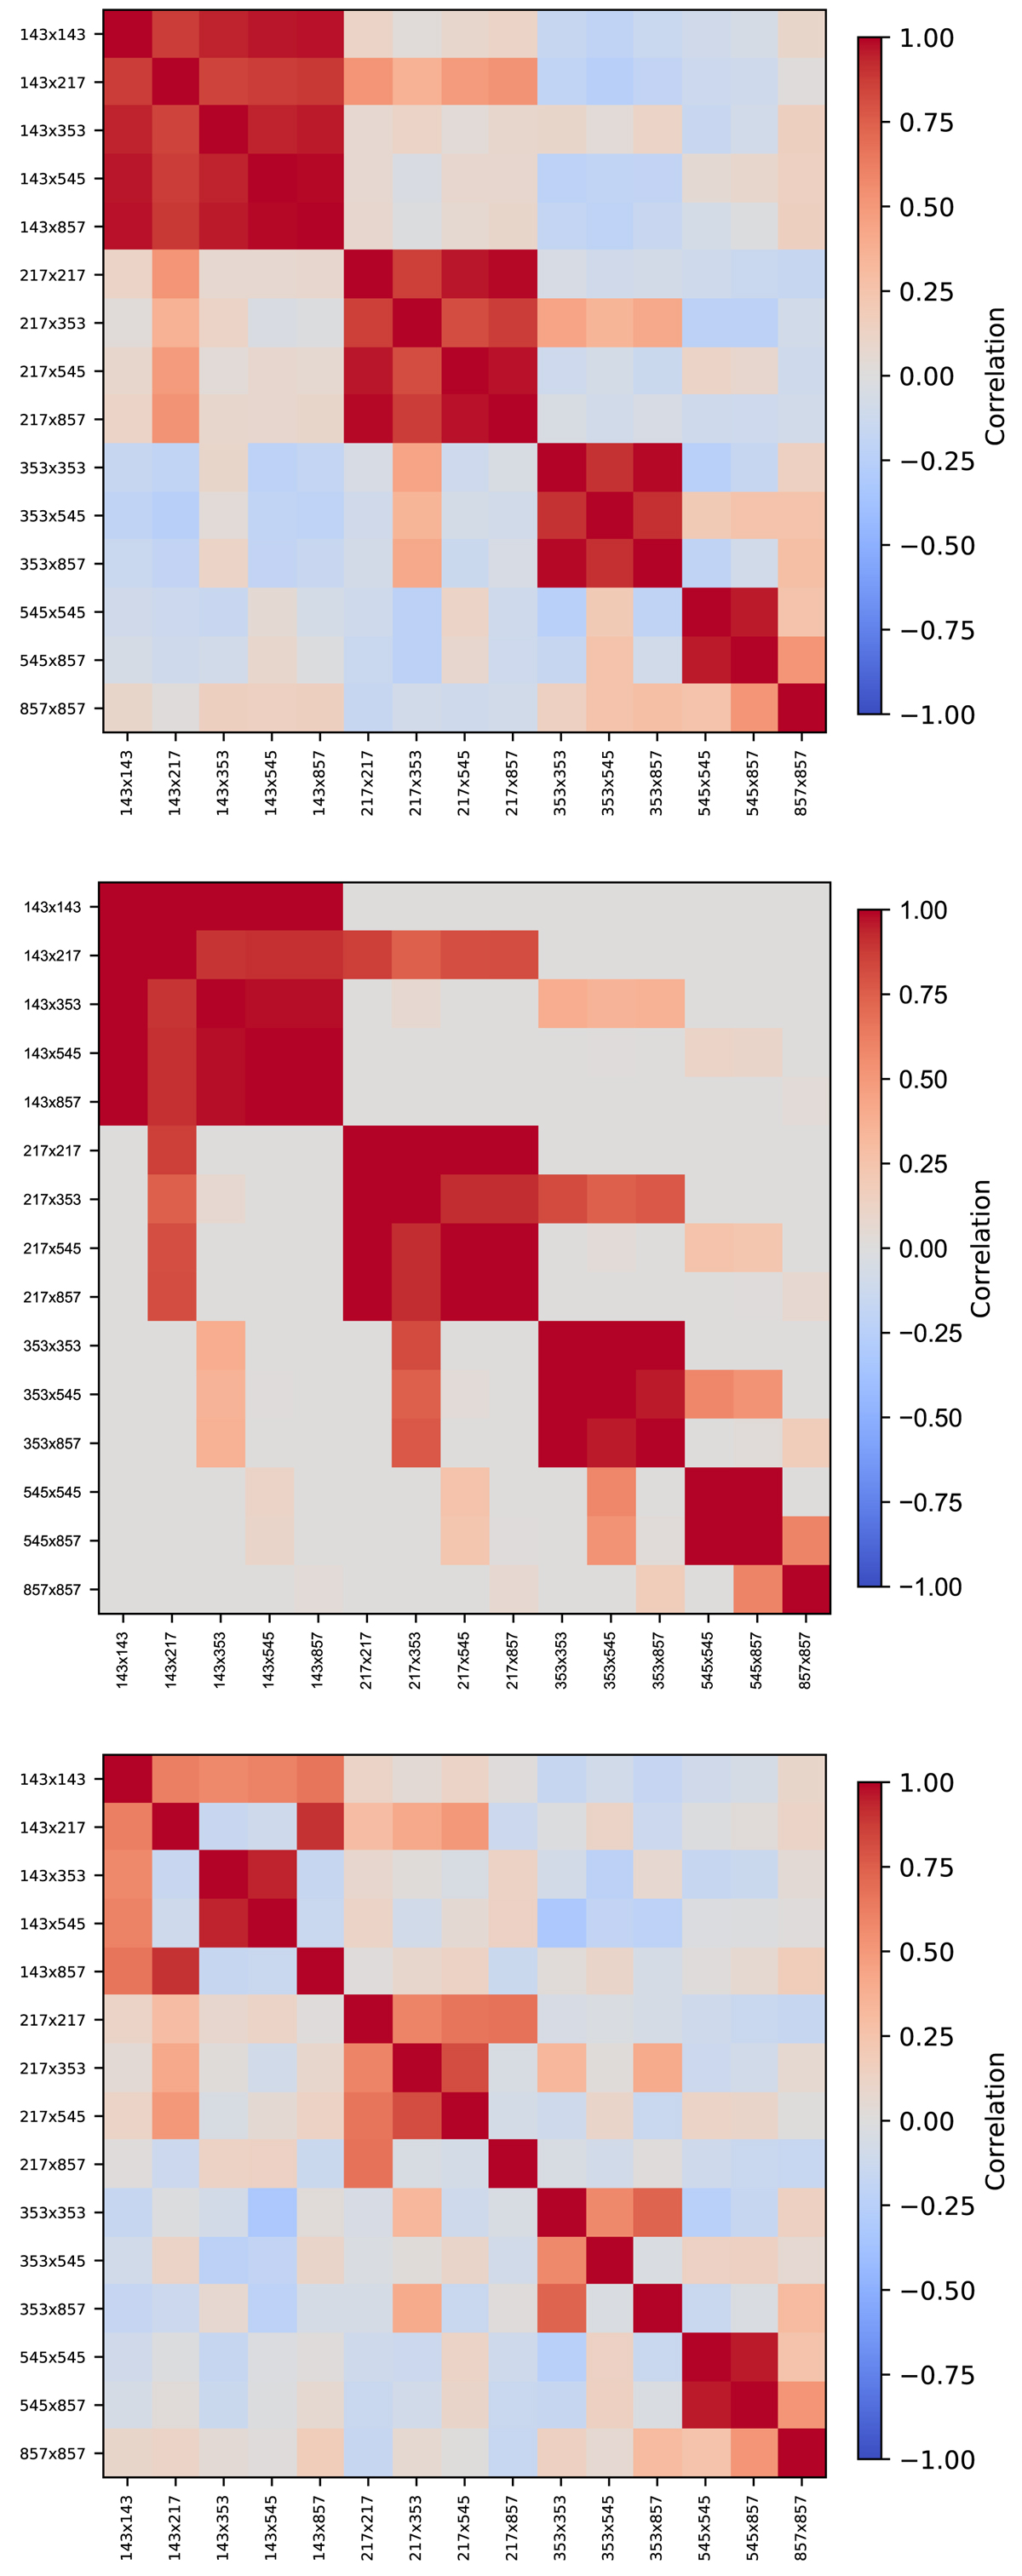
Cross-spectra correlation matrices computed from Eq. (B.2) for the SIM1 data set in the multipole bin centered at ℓ = 100. Upper panel: correlation matrix computed from the cross-spectra as defined in Eq. (B.1). Middle panel: correlation matrix computed for our toy-model of the correlation presented in Appendix B.2. Bottom panel: correlation matrix computed from the cross-spectra as defined in Eq. (B.6).
Current usage metrics show cumulative count of Article Views (full-text article views including HTML views, PDF and ePub downloads, according to the available data) and Abstracts Views on Vision4Press platform.
Data correspond to usage on the plateform after 2015. The current usage metrics is available 48-96 hours after online publication and is updated daily on week days.
Initial download of the metrics may take a while.