Fig. C.1.
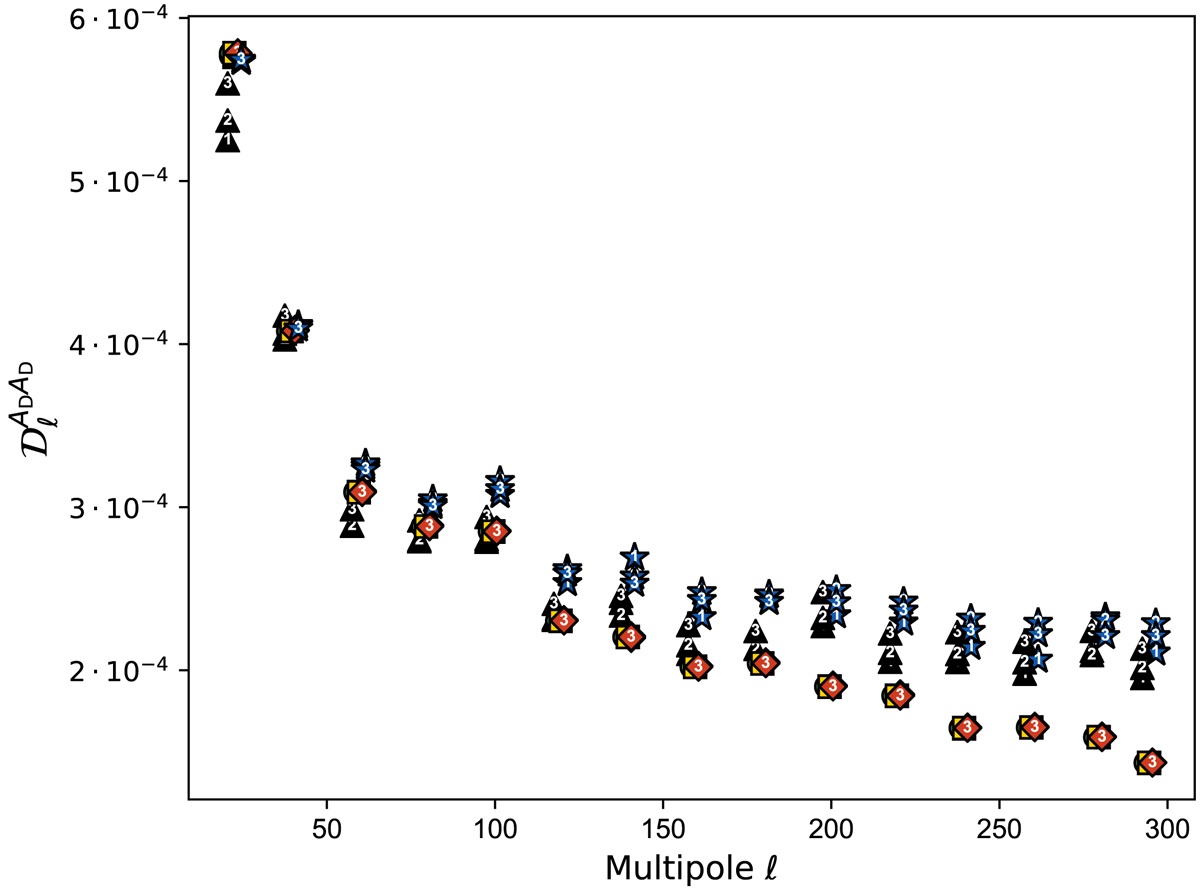
Corrected dust amplitude ![]() after step 3 of the fit, when truncating Eq. (5) at first order (“1” label on the plot markers), second order (“2” label), and third order (“3” label, same values as those in Sect. 5). The symbols refer to the different data sets: SIM1 (green circles), SIM2 (yellow squares), SIM3 (red diamond), SIM4 (blue stars), and PR3 (black triangles).
after step 3 of the fit, when truncating Eq. (5) at first order (“1” label on the plot markers), second order (“2” label), and third order (“3” label, same values as those in Sect. 5). The symbols refer to the different data sets: SIM1 (green circles), SIM2 (yellow squares), SIM3 (red diamond), SIM4 (blue stars), and PR3 (black triangles).
Current usage metrics show cumulative count of Article Views (full-text article views including HTML views, PDF and ePub downloads, according to the available data) and Abstracts Views on Vision4Press platform.
Data correspond to usage on the plateform after 2015. The current usage metrics is available 48-96 hours after online publication and is updated daily on week days.
Initial download of the metrics may take a while.