Fig. A.1.
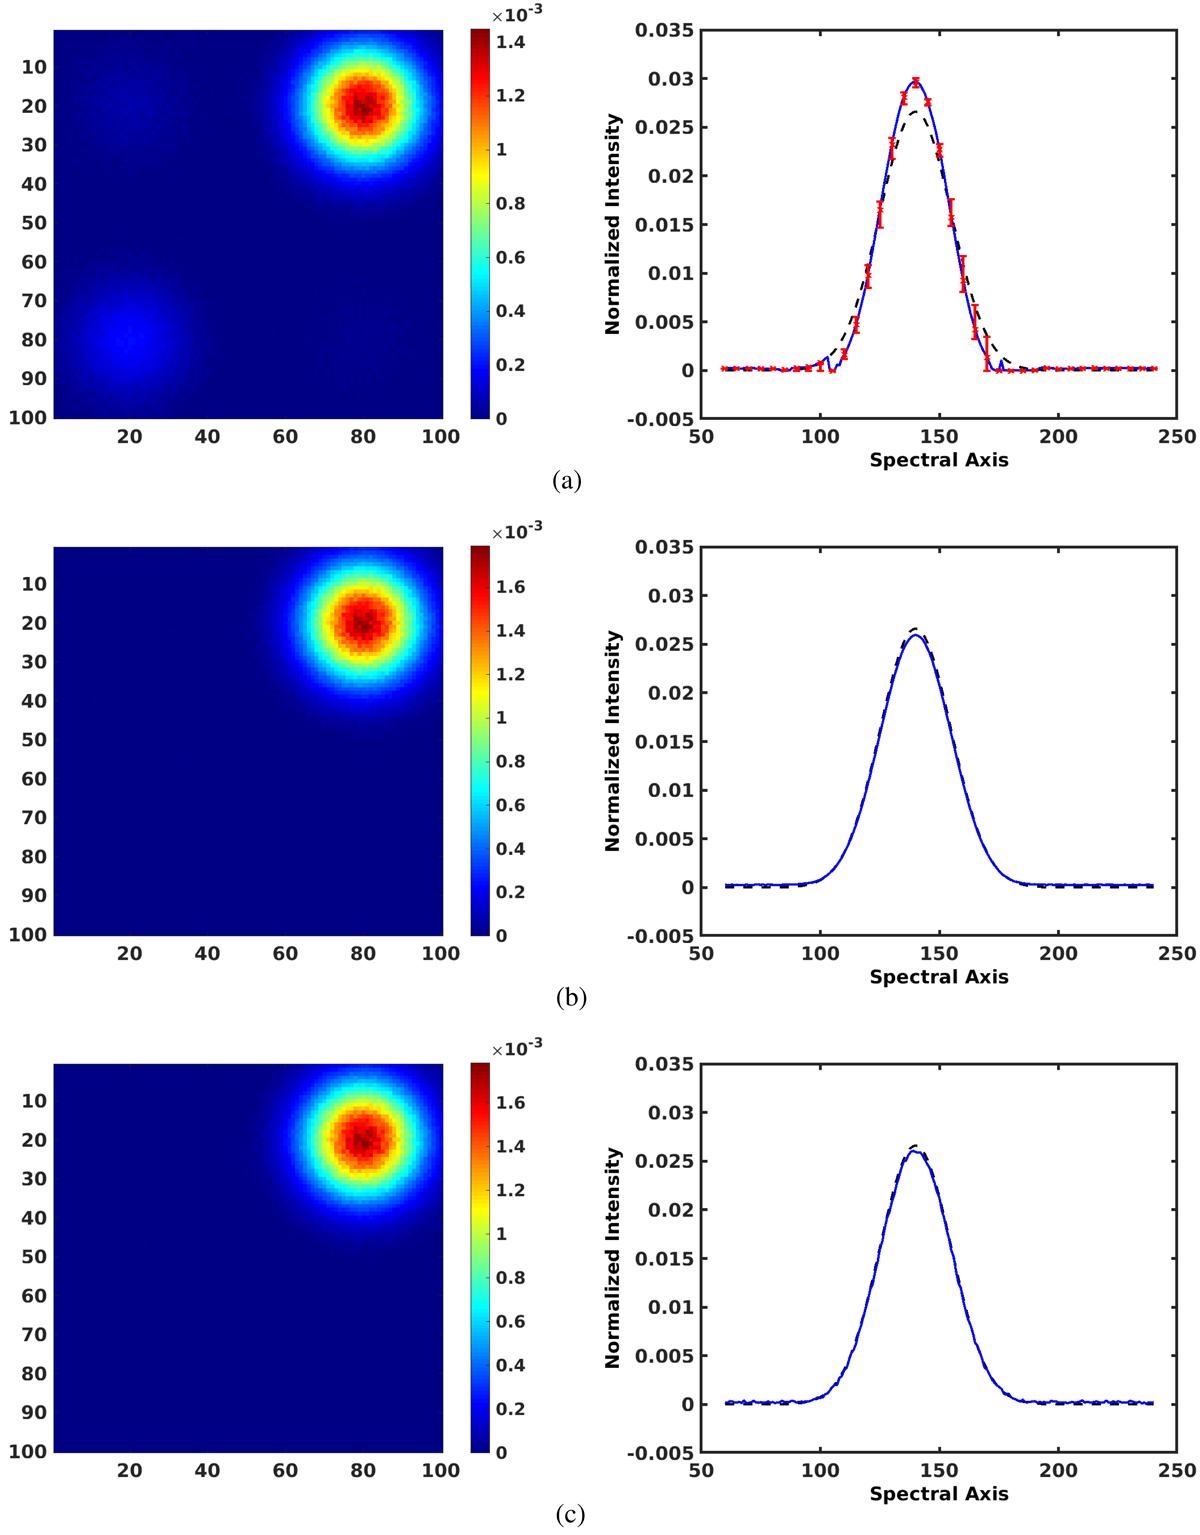
Results of the decomposition for the MC-NMF, SpaceCorr, and MASS methods in the most sparse case (d = 6σMap). Estimated spectrum is in blue, actual spectrum is in black dashes, and red error bars give the spread of the solutions of MC-NMF. Each subfigure caption contains the name of the considered BSS method, followed by the NRMSE of the estimated abundance map and the SAM of the estimated spectrum (see Eqs. (35) and (36)). This also applies to the subsequent figures. (a) MC-NMF (20.81%, 0.107 rad). (b) SpaceCorr (2.69%, 0.019 rad). (c) MASS (2.07%, 0.019 rad).
Current usage metrics show cumulative count of Article Views (full-text article views including HTML views, PDF and ePub downloads, according to the available data) and Abstracts Views on Vision4Press platform.
Data correspond to usage on the plateform after 2015. The current usage metrics is available 48-96 hours after online publication and is updated daily on week days.
Initial download of the metrics may take a while.