Fig. 2.
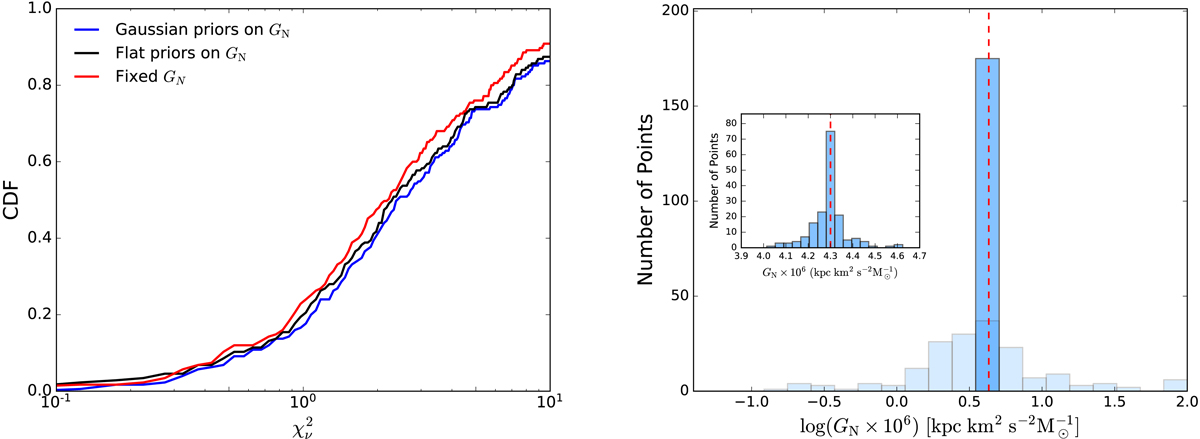
Left: cumulative distribution functions of ![]() fixing GN (red line) or imposing empirical lognormal priors (blue line) and flat priors (black line) on GN. The three cases show indistinguishable fit qualities. Right: histograms of the maximum-likelihood GN. The dark and light blue histograms correspond to lognormal and flat priors on GN, respectively. The inset (right panel) shows a zoom-in on the distribution for the Gaussian prior, switched to linear scale for a better view. The actual value of GN is indicated by red dashed lines. The Gaussian prior returns a tight distribution of GN without decreasing the fit quality; this confirms the constancy of GN as expected. The same argument has been applied for the constancy of g† in Li et al. (2018).
fixing GN (red line) or imposing empirical lognormal priors (blue line) and flat priors (black line) on GN. The three cases show indistinguishable fit qualities. Right: histograms of the maximum-likelihood GN. The dark and light blue histograms correspond to lognormal and flat priors on GN, respectively. The inset (right panel) shows a zoom-in on the distribution for the Gaussian prior, switched to linear scale for a better view. The actual value of GN is indicated by red dashed lines. The Gaussian prior returns a tight distribution of GN without decreasing the fit quality; this confirms the constancy of GN as expected. The same argument has been applied for the constancy of g† in Li et al. (2018).
Current usage metrics show cumulative count of Article Views (full-text article views including HTML views, PDF and ePub downloads, according to the available data) and Abstracts Views on Vision4Press platform.
Data correspond to usage on the plateform after 2015. The current usage metrics is available 48-96 hours after online publication and is updated daily on week days.
Initial download of the metrics may take a while.