Fig. C.1.
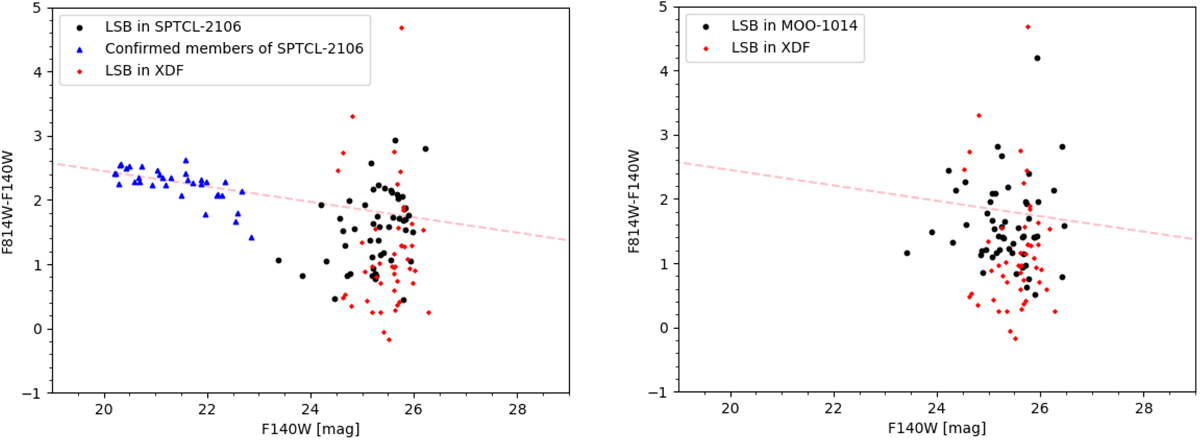
Colour-magnitude diagrams for the sample of LSB candidates in the clusters and the reference field that fall within the 50% detection limit. These are the raw numbers, without accounting for incompleteness or background interlopers. Left panel: cluster SPTCL-2106, right panel: cluster MOO-1014. Additionally shown in the left panel, we have the positions in the colour-magnitude diagram of spectroscopically-confirmed members of SPTCL-2106 and the same extrapolation of the red-sequence as described in Fig. 5.
Current usage metrics show cumulative count of Article Views (full-text article views including HTML views, PDF and ePub downloads, according to the available data) and Abstracts Views on Vision4Press platform.
Data correspond to usage on the plateform after 2015. The current usage metrics is available 48-96 hours after online publication and is updated daily on week days.
Initial download of the metrics may take a while.