Fig. 3.
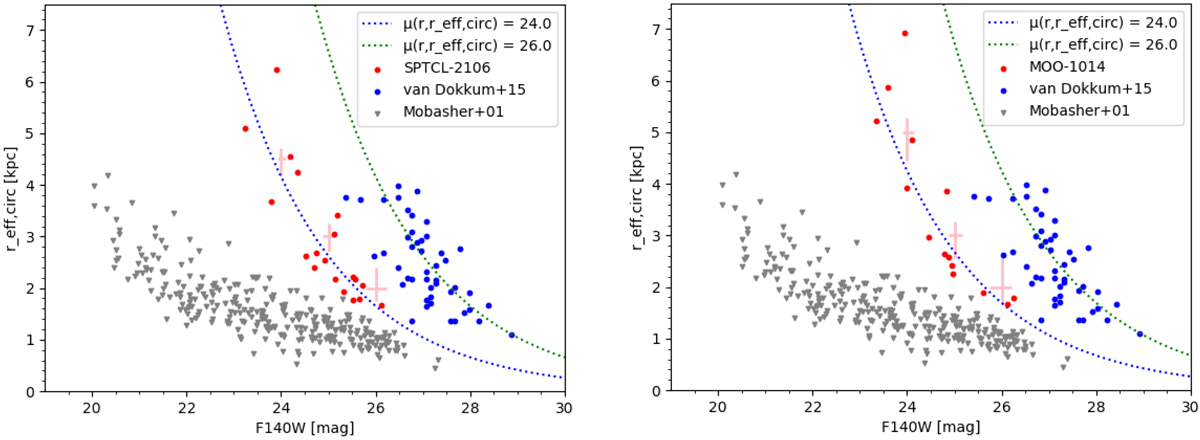
Selection by size and apparent magnitude in F140W of our LSB galaxies. The panels show the different clusters. Red: LSB galaxies detected following our selection criteria and with a weight higher than 0.5. Blue and grey: samples from van Dokkum et al. (2015a) and Mobasher et al. (2001), both shifted to our observed redshift by accounting for an E+K correction (see Sect. 4). We plot curves of constant surface brightness, μ(reff, circ) = 24.0, 26.0 mag arcsec−2 evolved from the Coma cluster redshift to the high-z clusters. Average error bars for our sample are shown.
Current usage metrics show cumulative count of Article Views (full-text article views including HTML views, PDF and ePub downloads, according to the available data) and Abstracts Views on Vision4Press platform.
Data correspond to usage on the plateform after 2015. The current usage metrics is available 48-96 hours after online publication and is updated daily on week days.
Initial download of the metrics may take a while.