Fig. 8
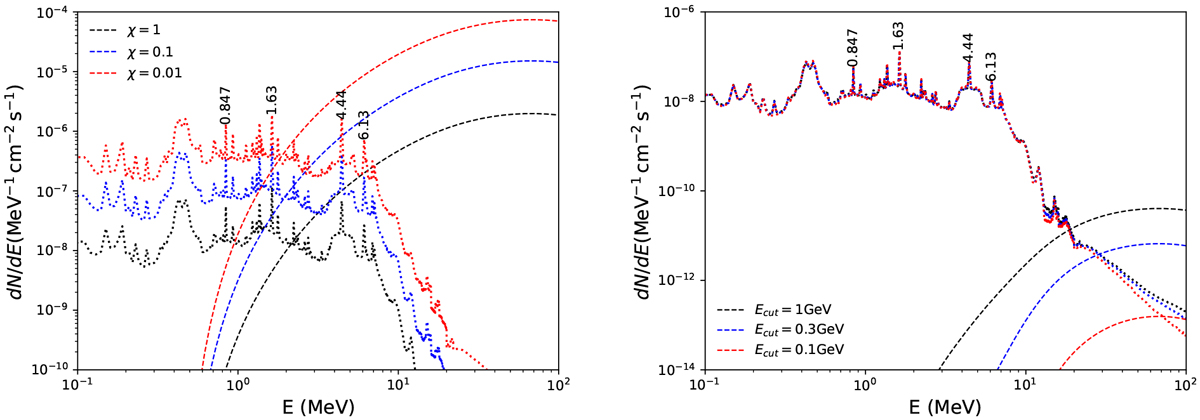
Comparison of γ-ray fluxes resulting from de-excitation of nuclei (dotted lines) and π0-decay process (dashed lines) integrated within 25 pc from the hypothetical CR source. Left panel: we assume a proton spectrum Fp (E) ∝ E−2 with various diffusion coefficient parameters, in which χ = 1.0 (black), 0.1 (blue), or 0.01 (red). Right panel: we assume χ = 1.0 and proton spectra Fp(E) ∝ E−2exp(−E∕Ecut) with various cutoff energies, in which Ecut = 1 GeV (black), 300 MeV (blue), or 100 MeV (red). Meanwhile, Q∕d2 = 1038erg s−1 kpc−2 and n = 1 cm−3 are assumedin both panels.
Current usage metrics show cumulative count of Article Views (full-text article views including HTML views, PDF and ePub downloads, according to the available data) and Abstracts Views on Vision4Press platform.
Data correspond to usage on the plateform after 2015. The current usage metrics is available 48-96 hours after online publication and is updated daily on week days.
Initial download of the metrics may take a while.