Fig. 7
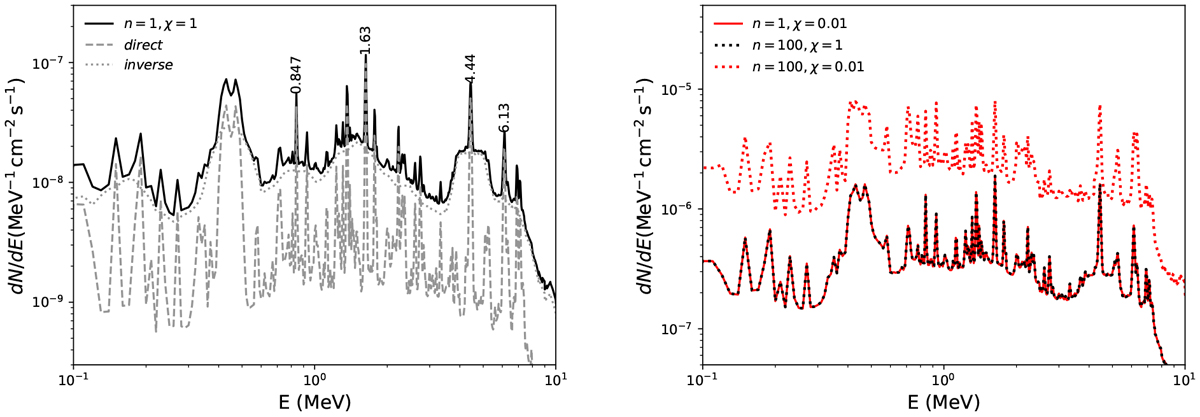
Comparison of the integrated γ-ray differential fluxes for different n (1 or 100 cm−3) and χ (1.0 or 0.01). Left panel: solid line show the total γ-ray flux integrated within r = 25 pc from the hypothetical CR source, assuming χ = 1.0 and n = 1 cm−3, and the dashed and dotted lines correspond to the contributions from the direct and inverse processes, respectively. Right panel: lines represent the total integrated γ-ray line emissionunder different assumptions of n and χ. In both panels, we assume Q∕d2 = 1 × 1038 erg s−1 kpc−2, s = 2.0.
Current usage metrics show cumulative count of Article Views (full-text article views including HTML views, PDF and ePub downloads, according to the available data) and Abstracts Views on Vision4Press platform.
Data correspond to usage on the plateform after 2015. The current usage metrics is available 48-96 hours after online publication and is updated daily on week days.
Initial download of the metrics may take a while.