Fig. 2
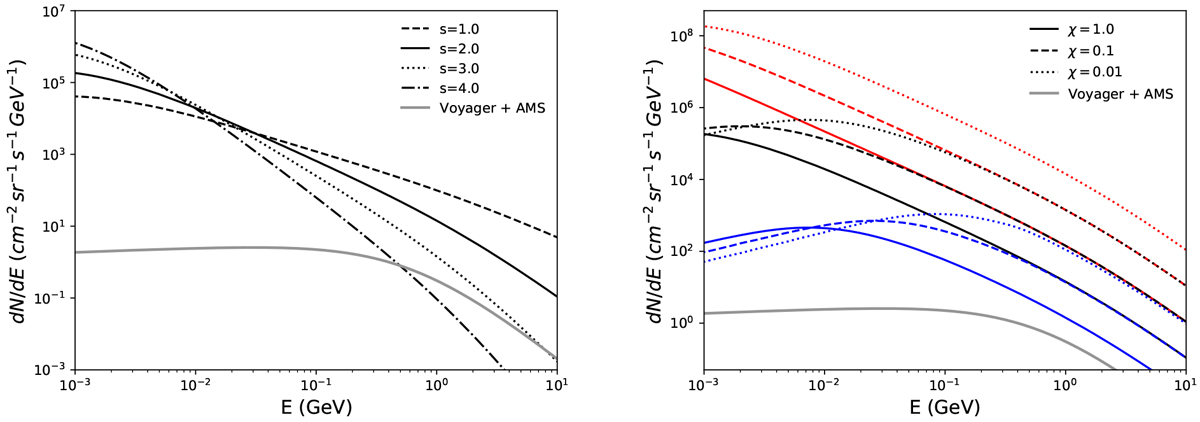
Calculated proton spectra under different assumptions. Left panel: proton spectra at the radical distance r = 10 pc from the hypothetical CR source with various injection spectral indices, in which s = 1.0 (dashed line), 2.0 (solid line), 3.0 (dotted line), and 4.0 (dash-dotted line), assuming a diffusion coefficient parameter χ = 1.0. Right panel: proton spectra with injection spectral index s = 2.0 under various assumptions of diffusion coefficients (solid lines for χ = 1.0, dashed lines for χ = 0.1, and dotted lines for χ = 0.01) at different radial distances, where r = 1 pc (red), 10pc (black), or 100 pc (blue). In both panels, Q∕d2 = 1 × 1038 erg s−1 kpc−2 and n = 1 cm−3 are assumed, and the gray lines represents the fit of the CR proton intensity from Phan et al. (2018) based on the measured fluxes of local CRs reported by Voyager 1 (Cummings et al. 2016) and AMS-02 (Aguilar et al. 2015a).
Current usage metrics show cumulative count of Article Views (full-text article views including HTML views, PDF and ePub downloads, according to the available data) and Abstracts Views on Vision4Press platform.
Data correspond to usage on the plateform after 2015. The current usage metrics is available 48-96 hours after online publication and is updated daily on week days.
Initial download of the metrics may take a while.