Fig. 4.
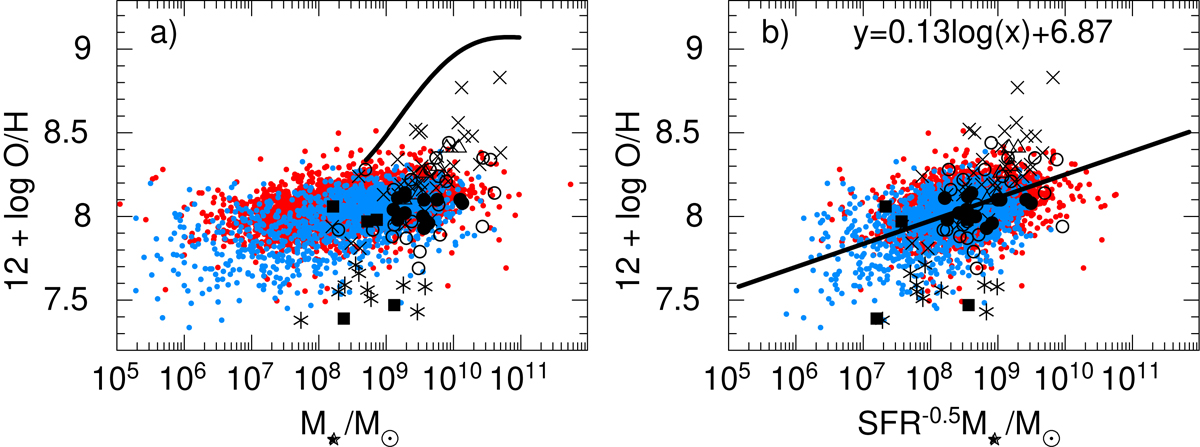
Dependences of oxygen abundances 12 + logO/H on (a) stellar masses M⋆ and on (b) SFR−0.5 M⋆ for the samples of CSFGs and high-z SFGs. The maximum likelihood relation to SDSS data in (b) is shown by the straight solid line. The black line in (a) is the relation for z = 0 SDSS SFGs by Mannucci et al. (2010). Large symbols represent high-z SFGs by Amorín et al. (2017) (z = 2.4–3.5, asterisks), Erb et al. (2016) (z ∼ 2.3, filled circles), Troncoso et al. (2014) (z ∼ 3–5, open circles), Onodera et al. (2016) (z ∼ 3–3.7, crosses), Cullen et al. (2014) (z > 2, open triangles) and Jones et al. (2020) (z = 7.1–9.1, filled squares). The meanings of symbols for SDSS CSFGs in both panels are the same as in Fig. 1.
Current usage metrics show cumulative count of Article Views (full-text article views including HTML views, PDF and ePub downloads, according to the available data) and Abstracts Views on Vision4Press platform.
Data correspond to usage on the plateform after 2015. The current usage metrics is available 48-96 hours after online publication and is updated daily on week days.
Initial download of the metrics may take a while.