Fig. 14.
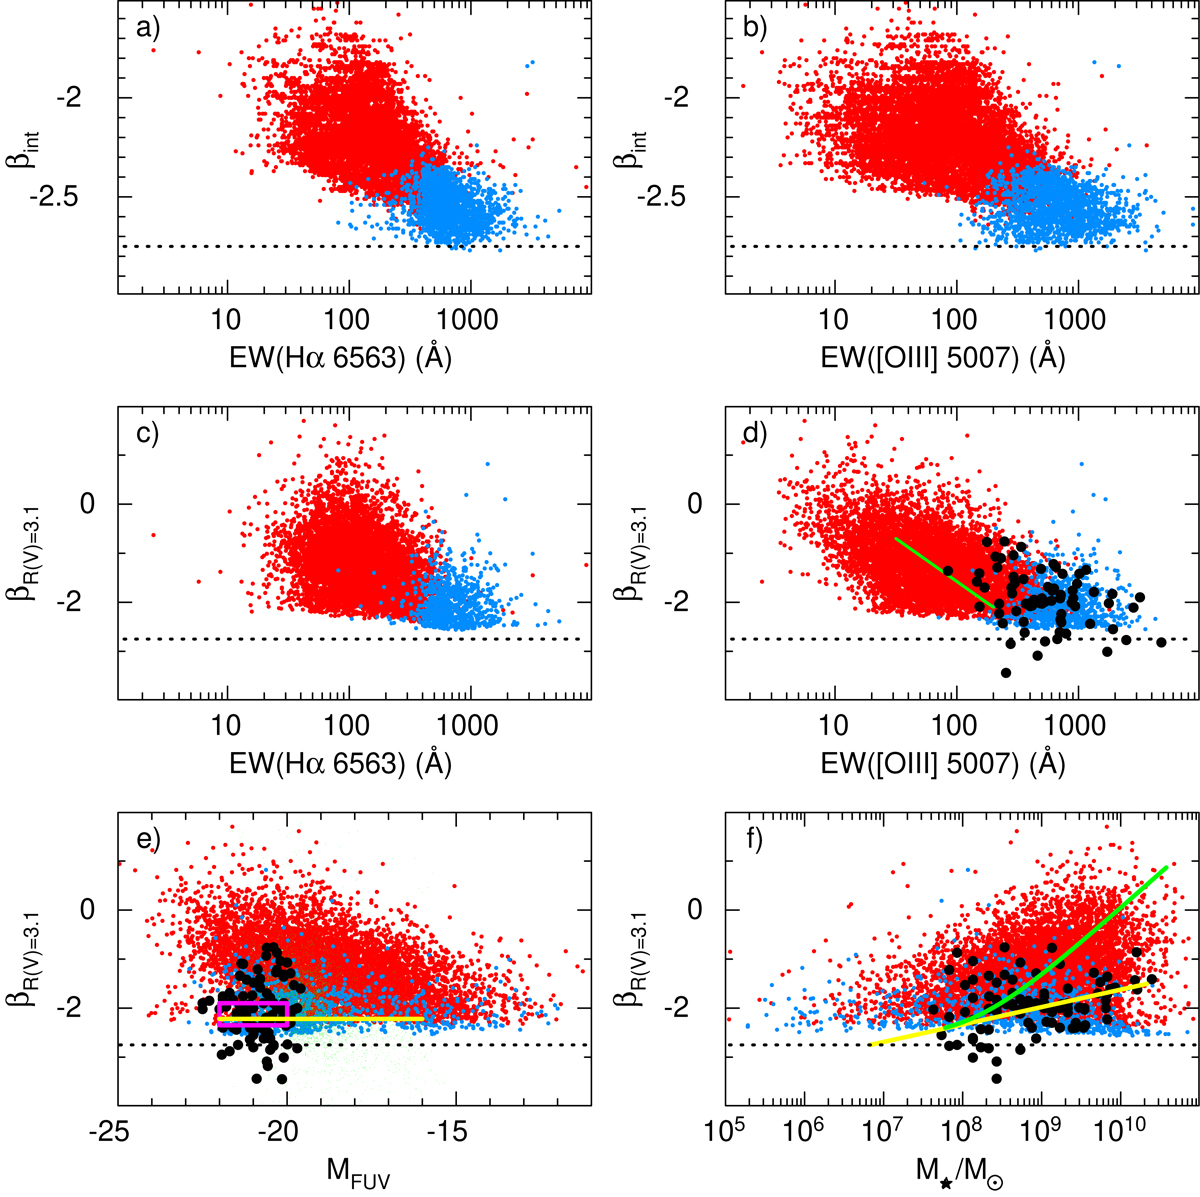
Dependences of the intrinsic (i.e. with zero extinction) UV SED slopes βint on (a) the Hα equivalent widths and (b) the [O III] λ5007 equivalent widths; (c) and (d) are the same as (a) and (b), but for the SEDs reddened with the extinction coefficients derived from the hydrogen Balmer decrements and assuming the Cardelli et al. (1989) reddening law with R(V) = 3.1. The green line in (d) is the relation for z = 1.4–3.8 SFGs (Reddy et al. 2018) whereas z = 3.5 LBGs (Holden et al. 2016), z ∼ 7 galaxies with high EW([O III] + Hβ) (Endsley et al. 2021) and z ∼ 6.6 SFGs with Lyα emission (Endsley et al. 2020) are shown by filled circles. (e) Dependence of βR(V) = 3.1 on the absolute FUV magnitudes MFUV calculated using the intrinsic SEDs. Green dots are for z ∼ 4–8 SFGs (Bouwens et al. 2012, 2014), black-filled circles are for z ∼ 6 SFGs (Pentericci et al. 2018), for z ∼ 6.6 SFGs with Lyα emission (Endsley et al. 2020), for median values of z ∼ 2–5 LAEs (Santos et al. 2020), for z ∼ 7 SFGs with high EW([O III] + Hβ) (Endsley et al. 2021) and for z = 5.7–6.6 LAEs with extremely steep UV continua (Jiang et al. 2020). The magenta rectangle delineates the location of stacks for z ∼ 10 SFGs (Wilkins et al. 2016). (f) Dependence of βR(V) = 3.1 on stellar masses M⋆. Black-filled circles are for z ∼ 3.5 LBGs (Holden et al. 2016), for median values of z ∼ 2–5 LAEs (Santos et al. 2020), for z ∼ 7 SFGs with high EW([O III] + Hβ) (Endsley et al. 2021), for z ∼ 6.6 SFGs with Lyα emission (Endsley et al. 2020) and for stacks of SFGs at z ∼ 4–6 (Fudamoto et al. 2020), respectively. Yellow solid lines in (e) and (f) represent relations for z = 6–9 galaxies (Bhatawdekar & Conselice 2020), whereas the green solid line in (f) is the relation for z = 1.5–3.5 LBGs by Bouwens et al. (2020). Dotted horizontal lines in all panels indicate the lowest modelled intrinsic βint of −2.75. The meanings of symbols for SDSS CSFGss in all panels are the same as in Fig. 1.
Current usage metrics show cumulative count of Article Views (full-text article views including HTML views, PDF and ePub downloads, according to the available data) and Abstracts Views on Vision4Press platform.
Data correspond to usage on the plateform after 2015. The current usage metrics is available 48-96 hours after online publication and is updated daily on week days.
Initial download of the metrics may take a while.