Fig. 13.
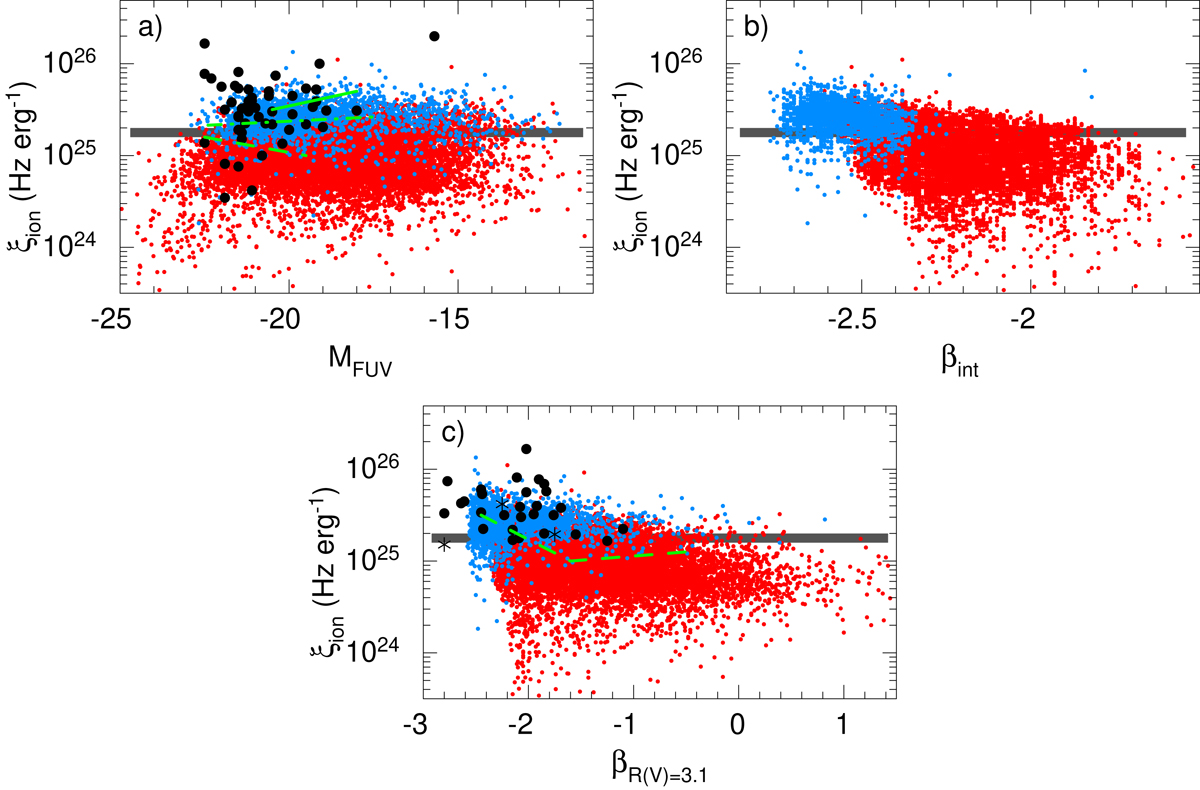
(a) Dependence of the ionising photon production efficiency ξion on the UV absolute magnitude MFUV. The LAEs at z ∼ 3 (Nakajima et al. 2020), z ∼ 6.6 SFGs with Lyα emission (Endsley et al. 2020), mean ξion values for z = 3.8–5.4 galaxies (Bouwens et al. 2016), mean ξion values for z = 4–5 galaxies (Lam et al. 2019b), and a mean ξion value for z = 3.8–5.4 faint galaxies with high EW(Lyα) (Maseda et al. 2020) are shown by filled circles. The relation for z ∼ 2 galaxies (Shivaei et al. 2018), for z ∼ 9–10 galaxies (Bouwens et al. 2019) and for z ∼ 3 faint Lyα emitters (Nakajima et al. 2018) are shown by green dashed, dash-dotted and solid lines, respectively. (b) Dependence of the ionising photon production efficiency ξion on the intrinsic UV slope β. (c) Dependence of the ionising photon production efficiency ξion on the intrinsic UV slope β reddened with R(V) = 3.1. Filled circles are z ∼ 3.8–5.4 galaxies (Bouwens et al. 2016) and z ∼ 6.6 SFGs with Lyα emission (Endsley et al. 2020), asterisks are mean ξion values of z = 4–5 galaxies (Lam et al. 2019b). The relation for z ∼ 2 galaxies (Shivaei et al. 2018) is shown by a green dashed line. Values of ξion assumed in canonical Universe reionisation models are shown (as in Figs. 11 and 12 in grey; e.g., Bouwens et al. 2016). The meanings of symbols for the SDSS CSFGs are the same as in Fig. 1.
Current usage metrics show cumulative count of Article Views (full-text article views including HTML views, PDF and ePub downloads, according to the available data) and Abstracts Views on Vision4Press platform.
Data correspond to usage on the plateform after 2015. The current usage metrics is available 48-96 hours after online publication and is updated daily on week days.
Initial download of the metrics may take a while.