Fig. 12.
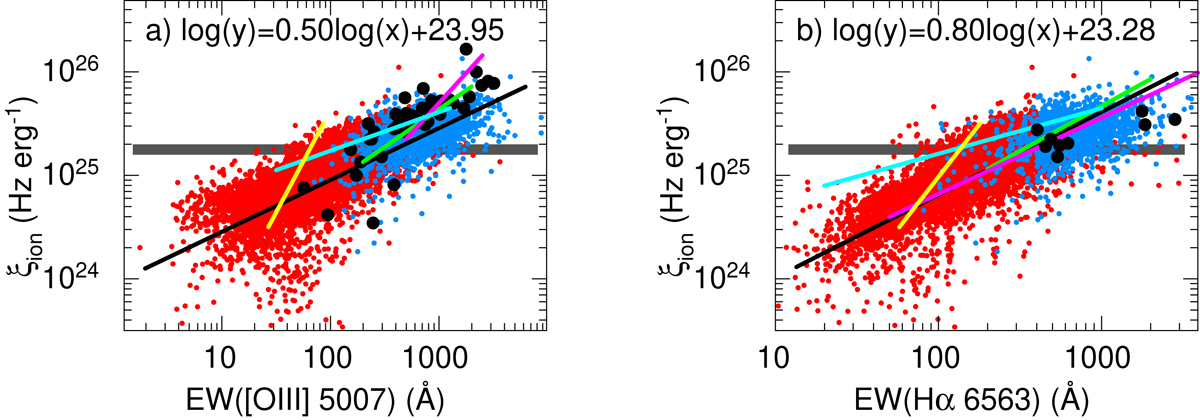
(a) and (b) Relations between ionising photon production efficiences, ξion, and equivalent widths of the [O III] λ5007 and Hαλ6563 emission lines for samples of CSFGs and high-z SFGs. The black solid lines are the maximum likelihood relations whereas green, magenta, cyan, and yellow solid lines in (a) are the relations for z ∼ 1.3–2.7 strong [O III] emitters (Tang et al. 2019), z ∼ 0 SFGs with EW([O III]) > 1000 Å (Chevallard et al. 2018), z ∼ 2 lensed galaxies (Emami et al. 2020), and z ∼ 1.4–3.8 galaxies (Reddy et al. 2018), respectively; LAEs at z ∼ 3 (Nakajima et al. 2020) and z ∼ 6.6 SFGs with Lyα emission (Endsley et al. 2020) are shown in (a) by black-filled circles. Mean ξion values for z = 4–5 galaxies (Lam et al. 2019b) are shown in (b) by filled circles. The lines in (b) are the relations for z ∼ 1.3–2.7 strong [O III] emitters (green line, Tang et al. 2019), z ∼ 4–6 SFGs (magenta line, Faisst et al. 2019), z ∼ 2 lensed galaxies (cyan line, Emami et al. 2020), and z ∼ 1.4–3.8 (yellow line, Reddy et al. 2018). Values for ξion assumed in canonical Universe reionisation models are shown with a thick horizontal grey line (e.g., Bouwens et al. 2016). The meanings of symbols for SDSS CSFGs are the same as in Fig. 1.
Current usage metrics show cumulative count of Article Views (full-text article views including HTML views, PDF and ePub downloads, according to the available data) and Abstracts Views on Vision4Press platform.
Data correspond to usage on the plateform after 2015. The current usage metrics is available 48-96 hours after online publication and is updated daily on week days.
Initial download of the metrics may take a while.