Fig. 11.
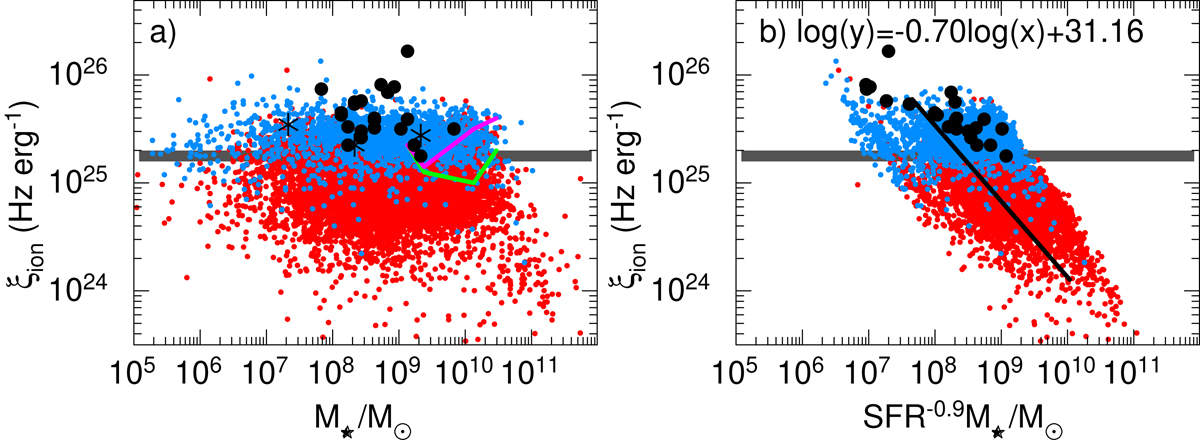
Relations between ionising photon production efficiences ξion and stellar masses M⋆ (a) and SFR−0.9M⋆ (b) for samples of CSFGs and high-z SFGs. The solid line in (b) is the maximum likelihood relation whereas stacks for z ∼ 1.4–2.6 SFGs (Shivaei et al. 2018) for Calzetti et al. (1994, 2000) and SMC reddening laws are shown in (a) by green and magenta lines, respectively. Mean ξion values of z = 4–5 galaxies (Lam et al. 2019b) in the three stellar mass bins are shown in (a) by asterisks, whereas z ∼ 6.6 SFGs with Lyα emission by Endsley et al. (2020) are represented in both panels by filled circles. Values of ξion assumed in canonical Universe reionisation models are shown with a thick horizontal grey line (e.g., Bouwens et al. 2016). The meanings of symbols for the SDSS CSFGs are the same as in Fig. 1.
Current usage metrics show cumulative count of Article Views (full-text article views including HTML views, PDF and ePub downloads, according to the available data) and Abstracts Views on Vision4Press platform.
Data correspond to usage on the plateform after 2015. The current usage metrics is available 48-96 hours after online publication and is updated daily on week days.
Initial download of the metrics may take a while.