Fig. 10.
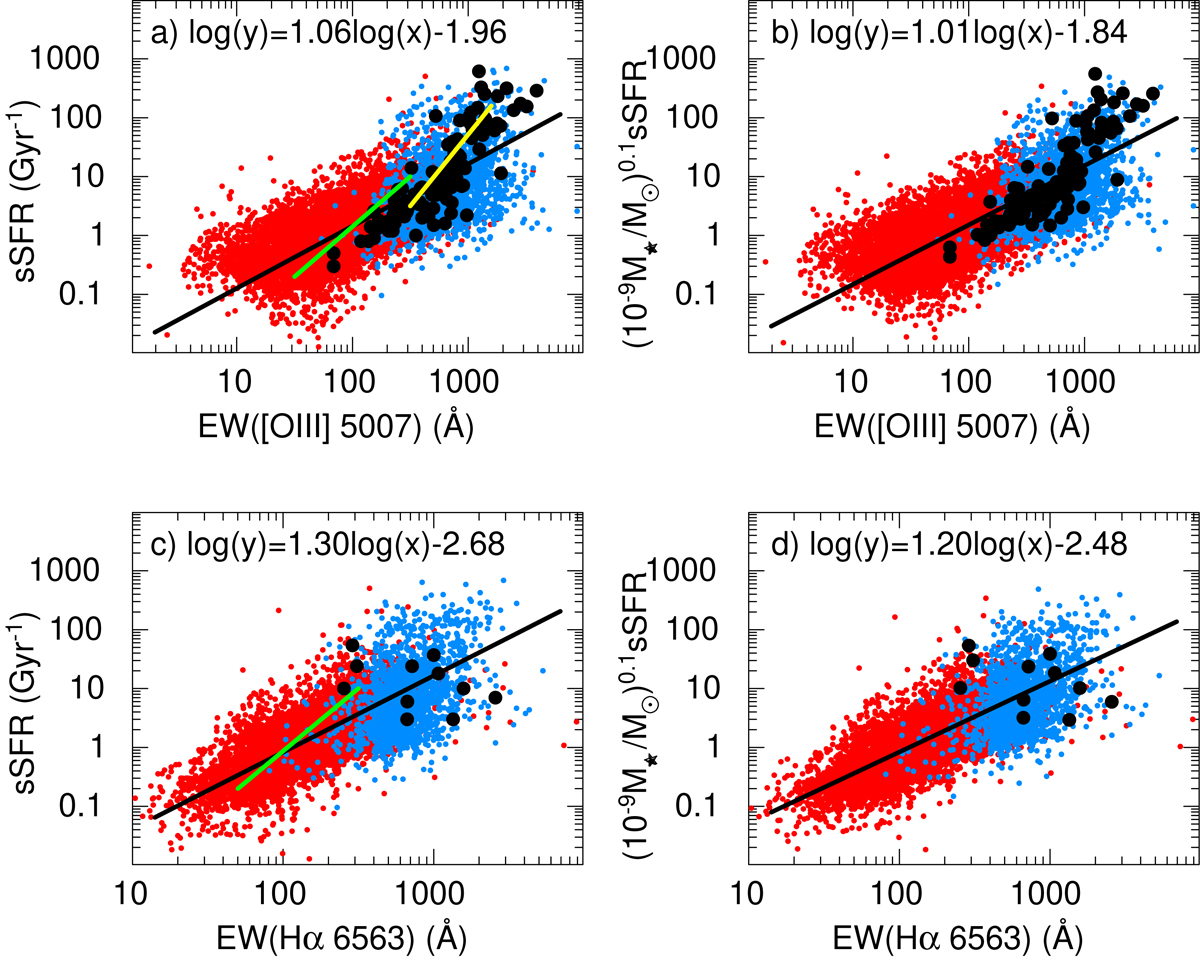
Dependences of specific star-formation rates sSFR ((a), (c)) and of ![]() sSFR ((b), (d)) on equivalent widths of the [O III] λ5007 and Hαλ6563 emission lines, respectively, for samples of CSFGs and high-z SFGs. Solid lines are the maximum likelihood relations. Galaxies denoted in (a) and (b) by black-filled circles are z ∼ 3.5 LBGs by Holden et al. (2016), z ∼ 1.3–3.7 galaxies with high EW([O III] + Hβ) by Tang et al. (2021), z ∼ 7 galaxies with high EW([O III] + Hβ) by Endsley et al. (2021) and z ∼ 6.6 galaxies with Lyα emission by Endsley et al. (2020). Galaxies represented in (c) and (d) by black-filled circles are z ∼ 5 SFRs by Rasappu et al. (2016). Yellow and green solid lines in (a) represent relations of z ∼ 2 analogues for z > 6.5 galaxies (Du et al. 2020) and z = 1.4–3.8 SFGs (Reddy et al. 2018), respectively, whereas the relation for z = 1.4–3.8 SFGs (Reddy et al. 2018) in (c) is shown by the green line. The meanings of symbols for SDSS CSFGs are the same as in Fig. 1.
sSFR ((b), (d)) on equivalent widths of the [O III] λ5007 and Hαλ6563 emission lines, respectively, for samples of CSFGs and high-z SFGs. Solid lines are the maximum likelihood relations. Galaxies denoted in (a) and (b) by black-filled circles are z ∼ 3.5 LBGs by Holden et al. (2016), z ∼ 1.3–3.7 galaxies with high EW([O III] + Hβ) by Tang et al. (2021), z ∼ 7 galaxies with high EW([O III] + Hβ) by Endsley et al. (2021) and z ∼ 6.6 galaxies with Lyα emission by Endsley et al. (2020). Galaxies represented in (c) and (d) by black-filled circles are z ∼ 5 SFRs by Rasappu et al. (2016). Yellow and green solid lines in (a) represent relations of z ∼ 2 analogues for z > 6.5 galaxies (Du et al. 2020) and z = 1.4–3.8 SFGs (Reddy et al. 2018), respectively, whereas the relation for z = 1.4–3.8 SFGs (Reddy et al. 2018) in (c) is shown by the green line. The meanings of symbols for SDSS CSFGs are the same as in Fig. 1.
Current usage metrics show cumulative count of Article Views (full-text article views including HTML views, PDF and ePub downloads, according to the available data) and Abstracts Views on Vision4Press platform.
Data correspond to usage on the plateform after 2015. The current usage metrics is available 48-96 hours after online publication and is updated daily on week days.
Initial download of the metrics may take a while.