Fig. 7.
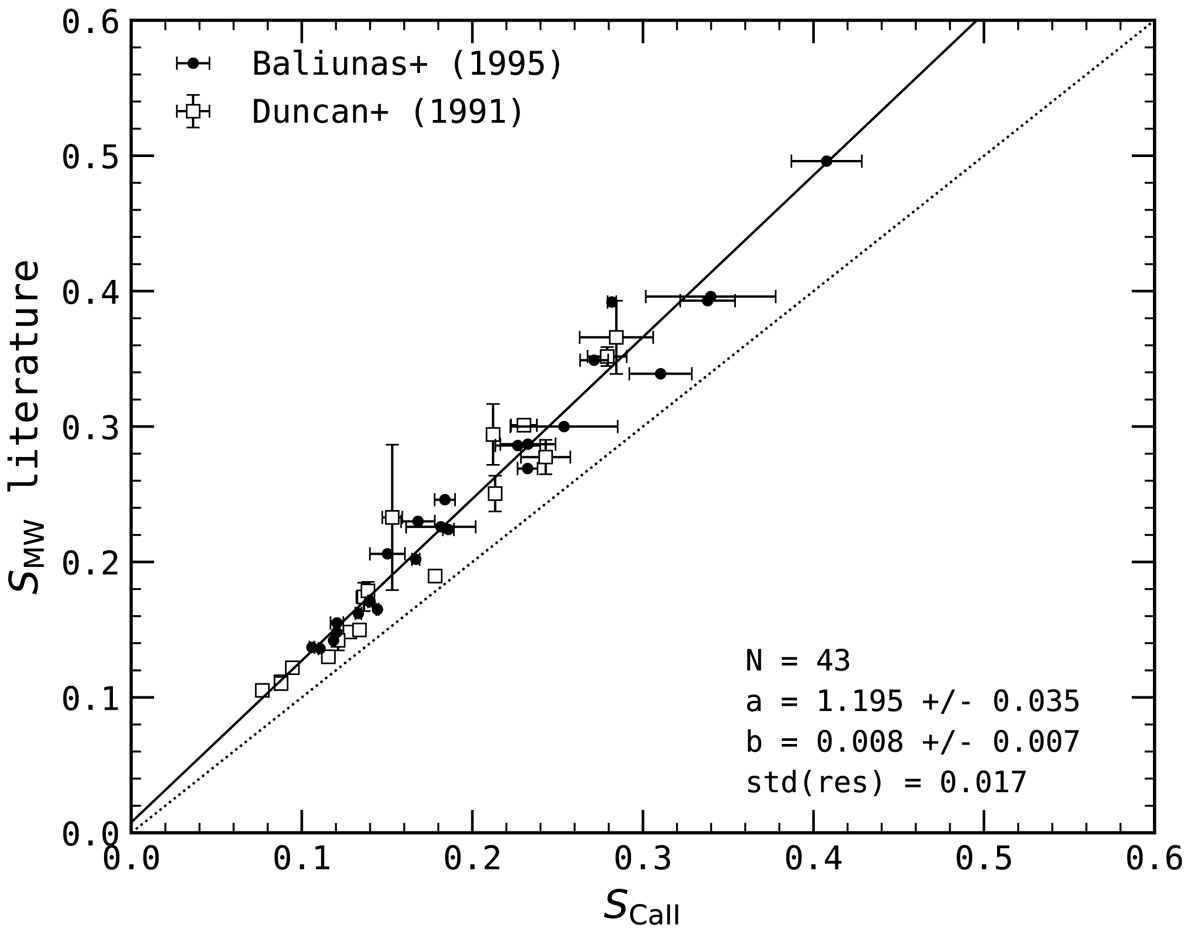
Calibration of SCaII to the Mt. Wilson scale using 43 stars with SMW values from Duncan et al. (1991) and Baliunas et al. (1995a). The solid black line is the best linear fit with slope (a) and intercept (b) coefficients shown in the plot with respective errors obtained from the diagonal of the covariance matrix. The residuals standard deviation is 0.017. Errors are the standard deviations of the data. Errors for the indices in Baliunas et al. (1995a) were not published. In some cases the errors are smaller than the symbols.
Current usage metrics show cumulative count of Article Views (full-text article views including HTML views, PDF and ePub downloads, according to the available data) and Abstracts Views on Vision4Press platform.
Data correspond to usage on the plateform after 2015. The current usage metrics is available 48-96 hours after online publication and is updated daily on week days.
Initial download of the metrics may take a while.