Free Access
Fig. 6.
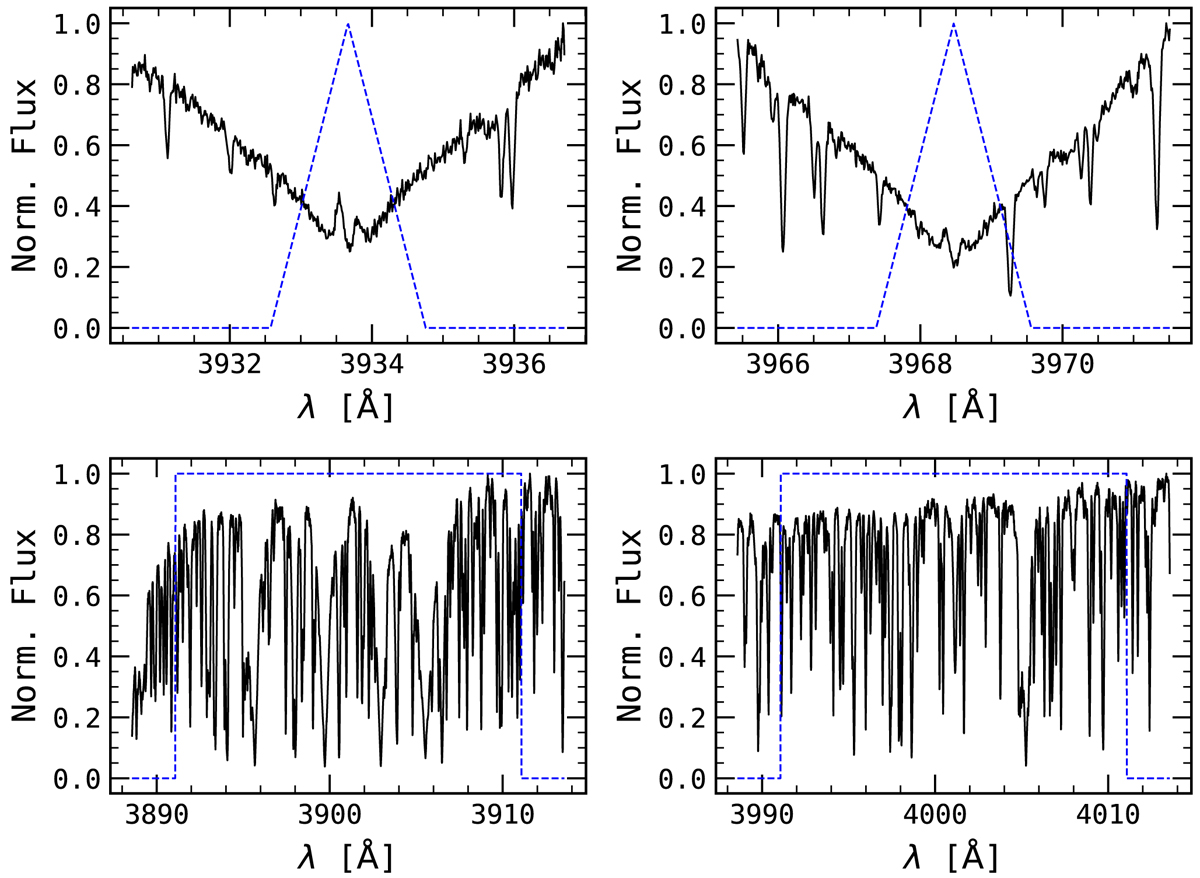
Example of the bandpasses used to calculate SCaII using a spectrum of τ Ceti. Upper panels: Ca II K line (left) and Ca II H line (right). Lower panels: Ca II blue reference band (left) and red band (right). Blue dashed lines are the bandpass functions.
Current usage metrics show cumulative count of Article Views (full-text article views including HTML views, PDF and ePub downloads, according to the available data) and Abstracts Views on Vision4Press platform.
Data correspond to usage on the plateform after 2015. The current usage metrics is available 48-96 hours after online publication and is updated daily on week days.
Initial download of the metrics may take a while.