Fig. B.1.
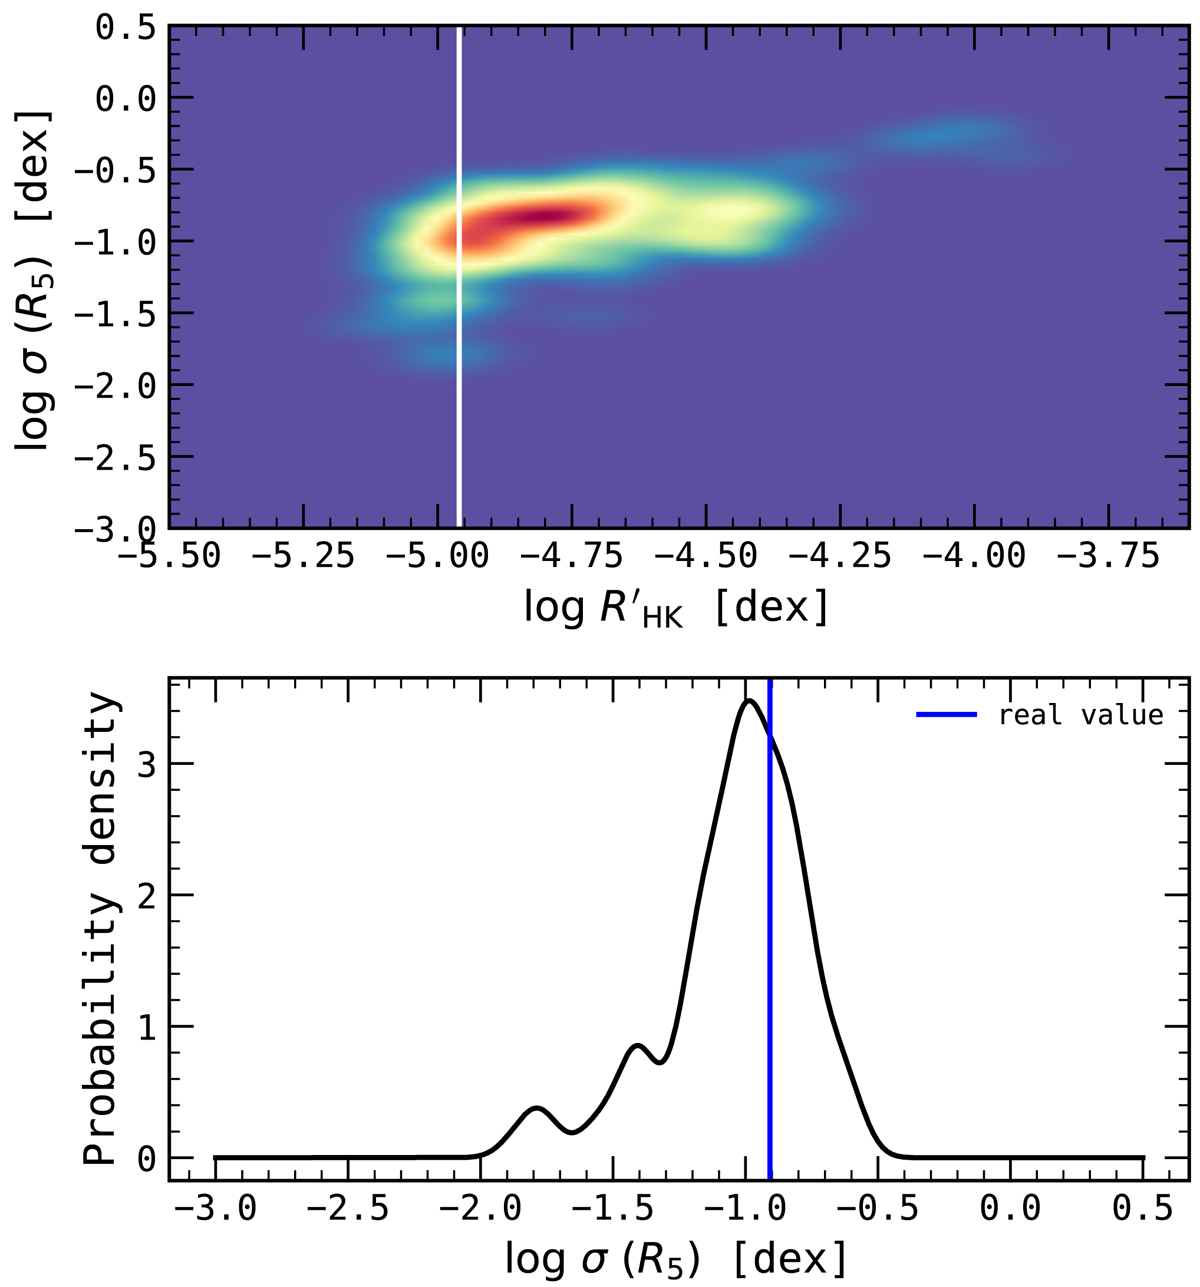
Upper panel: bivariate KDE of the logarithm of the weighted standard deviation of R5 against median values of log ![]() for stars with more than five nights of observation. Redder colours indicate higher density. The white vertical line indicates the activity level of α Cen B. Lower panel: activity variability probability function for the α Cen B activity level. The vertical blue line marks the value of the weighted R5 standard deviation of α Cen B obtained from the R5 time series.
for stars with more than five nights of observation. Redder colours indicate higher density. The white vertical line indicates the activity level of α Cen B. Lower panel: activity variability probability function for the α Cen B activity level. The vertical blue line marks the value of the weighted R5 standard deviation of α Cen B obtained from the R5 time series.
Current usage metrics show cumulative count of Article Views (full-text article views including HTML views, PDF and ePub downloads, according to the available data) and Abstracts Views on Vision4Press platform.
Data correspond to usage on the plateform after 2015. The current usage metrics is available 48-96 hours after online publication and is updated daily on week days.
Initial download of the metrics may take a while.