Fig. 20.
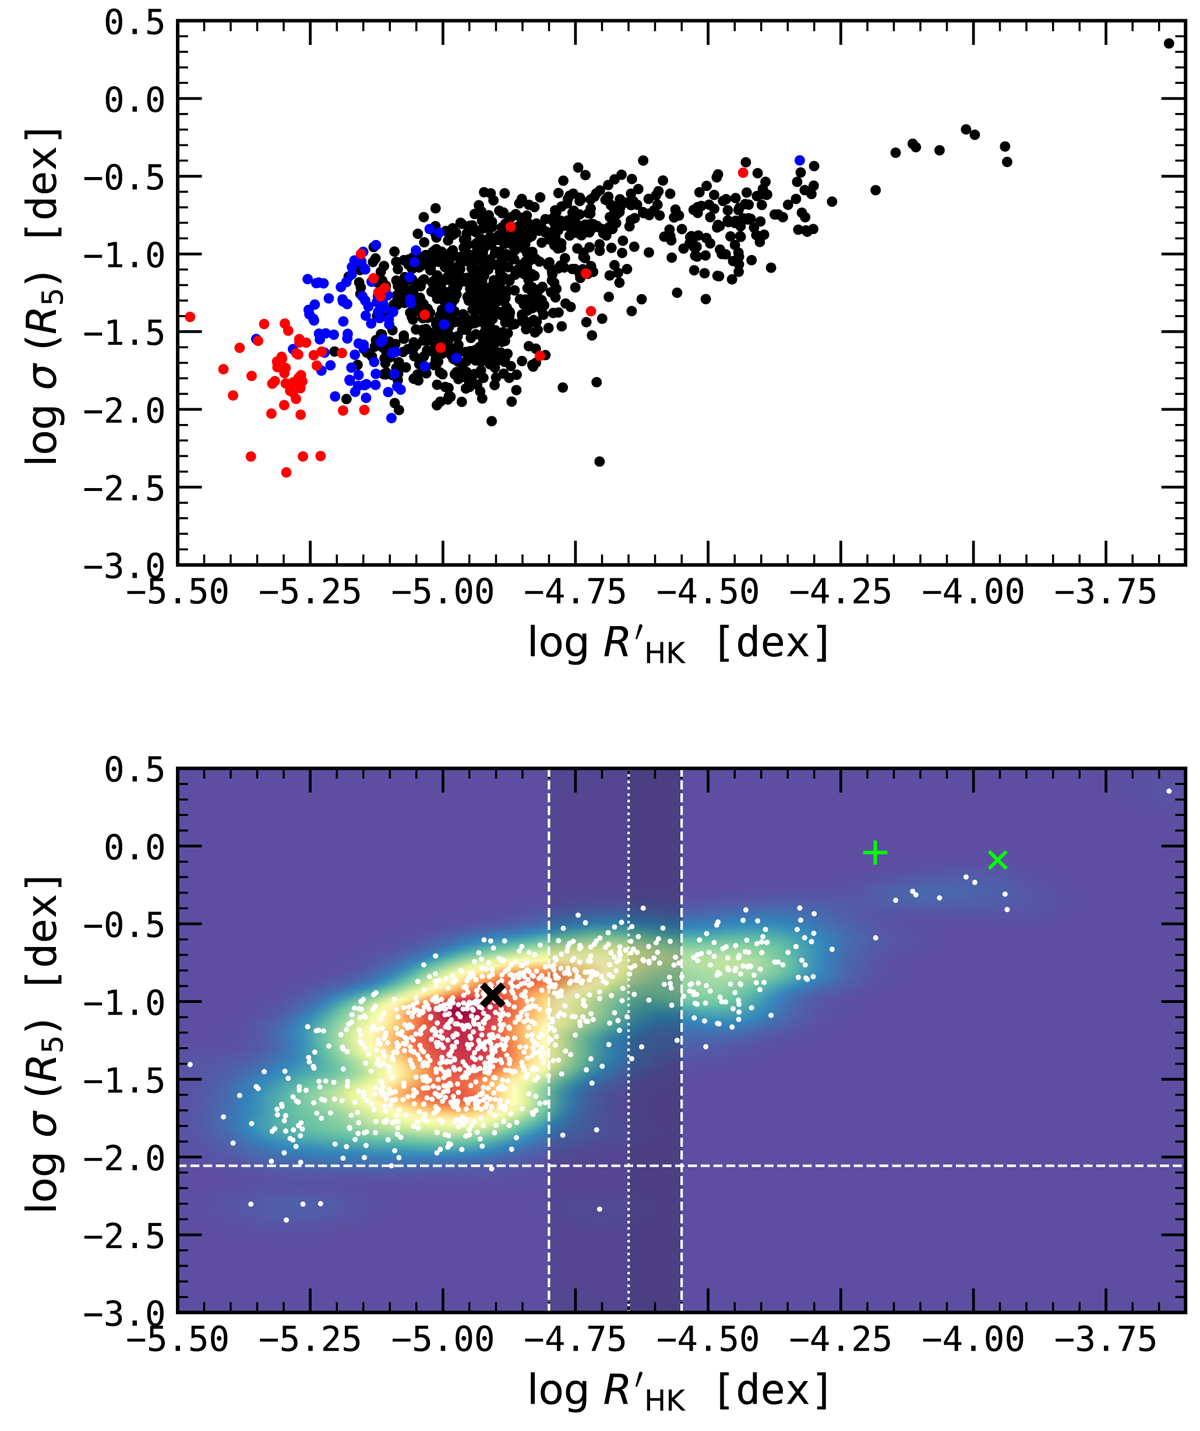
Upper panel: logarithm of the weighted standard deviation of R5 against median values of log ![]() for stars with more than five nights of observations. Red, blue, and black dots are giants, subgiants, and MS stars. Lower panel: bivariate KDE map of the logarithm of the weighed standard deviation of R5 against median values of log
for stars with more than five nights of observations. Red, blue, and black dots are giants, subgiants, and MS stars. Lower panel: bivariate KDE map of the logarithm of the weighed standard deviation of R5 against median values of log ![]() for stars with more than five nights of observation. Redder areas represent higher density zones. The KDE bandwidth used was 0.07. White dots are stars. The white dashed line marks the dispersion of the star with the least absolute variability, HD 60532, with log σ(R5) = − 2.05 dex. The position of the Sun, based on the values published by Mamajek & Hillenbrand (2008), is marked with a black ‘x’. The vertical white lines mark the approximate position of the gap we observe between active and inactive stars. The thinner gap, i.e. the region −4.55 < log
for stars with more than five nights of observation. Redder areas represent higher density zones. The KDE bandwidth used was 0.07. White dots are stars. The white dashed line marks the dispersion of the star with the least absolute variability, HD 60532, with log σ(R5) = − 2.05 dex. The position of the Sun, based on the values published by Mamajek & Hillenbrand (2008), is marked with a black ‘x’. The vertical white lines mark the approximate position of the gap we observe between active and inactive stars. The thinner gap, i.e. the region −4.55 < log ![]() < −4.65 dex, is located between the dotted line in the middle and the right dashed line, and has a darker shadow. The wider gap, at −4.8 < log
< −4.65 dex, is located between the dotted line in the middle and the right dashed line, and has a darker shadow. The wider gap, at −4.8 < log ![]() < −4.55 dex, is located between the two dashed lines and has a lighter shadow. The green cross and ‘x’ mark the positions of LQ Hya and EK Dra, respectively.
< −4.55 dex, is located between the two dashed lines and has a lighter shadow. The green cross and ‘x’ mark the positions of LQ Hya and EK Dra, respectively.
Current usage metrics show cumulative count of Article Views (full-text article views including HTML views, PDF and ePub downloads, according to the available data) and Abstracts Views on Vision4Press platform.
Data correspond to usage on the plateform after 2015. The current usage metrics is available 48-96 hours after online publication and is updated daily on week days.
Initial download of the metrics may take a while.