Free Access
Fig. 18.
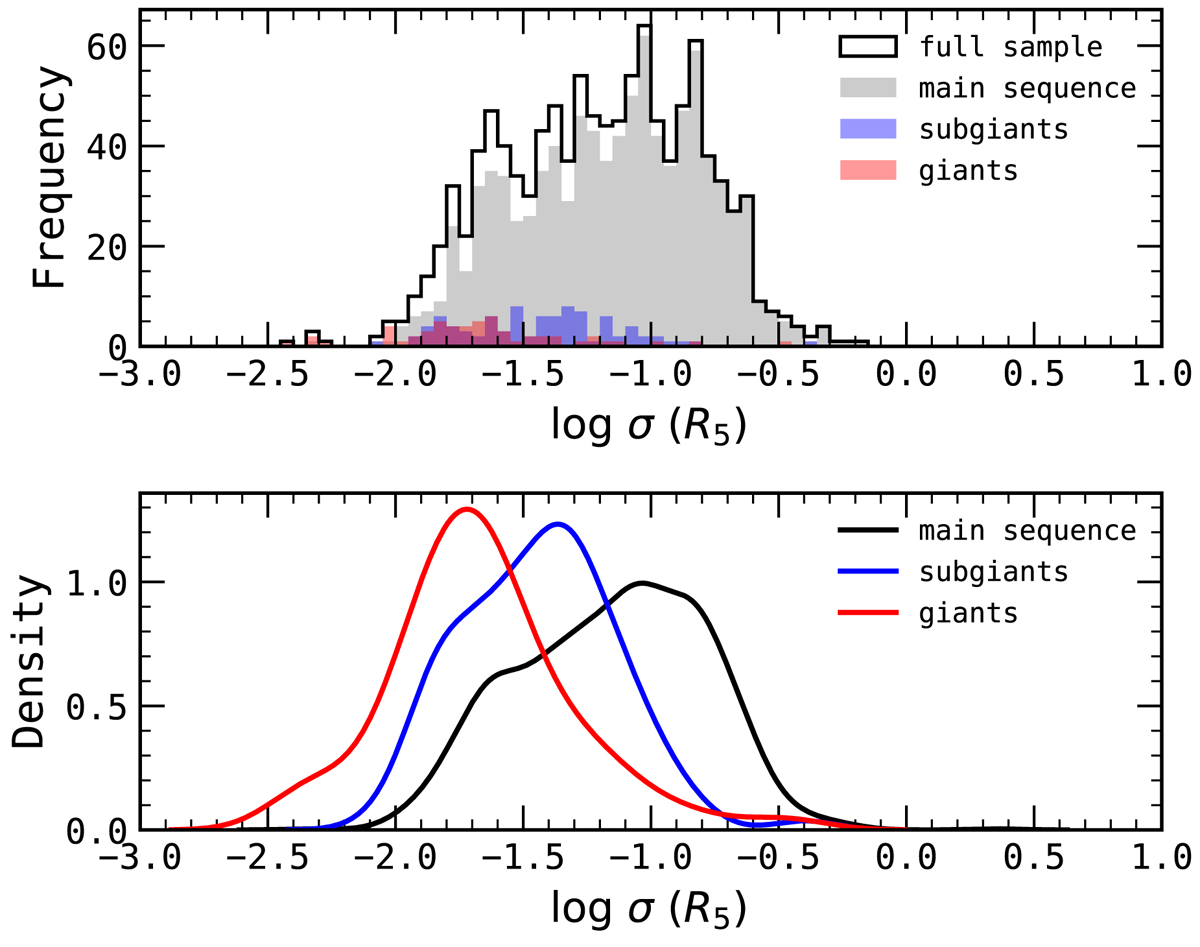
Upper panel: distribution of the logarithm of the weighted standard deviation of R5 for the full sample (black) segregated into MS (grey), subgiant (blue), and giant (red) luminosity classes. Lower panel: Gaussian KDE of the distributions for the different luminosity classes.
Current usage metrics show cumulative count of Article Views (full-text article views including HTML views, PDF and ePub downloads, according to the available data) and Abstracts Views on Vision4Press platform.
Data correspond to usage on the plateform after 2015. The current usage metrics is available 48-96 hours after online publication and is updated daily on week days.
Initial download of the metrics may take a while.