Fig. 17.
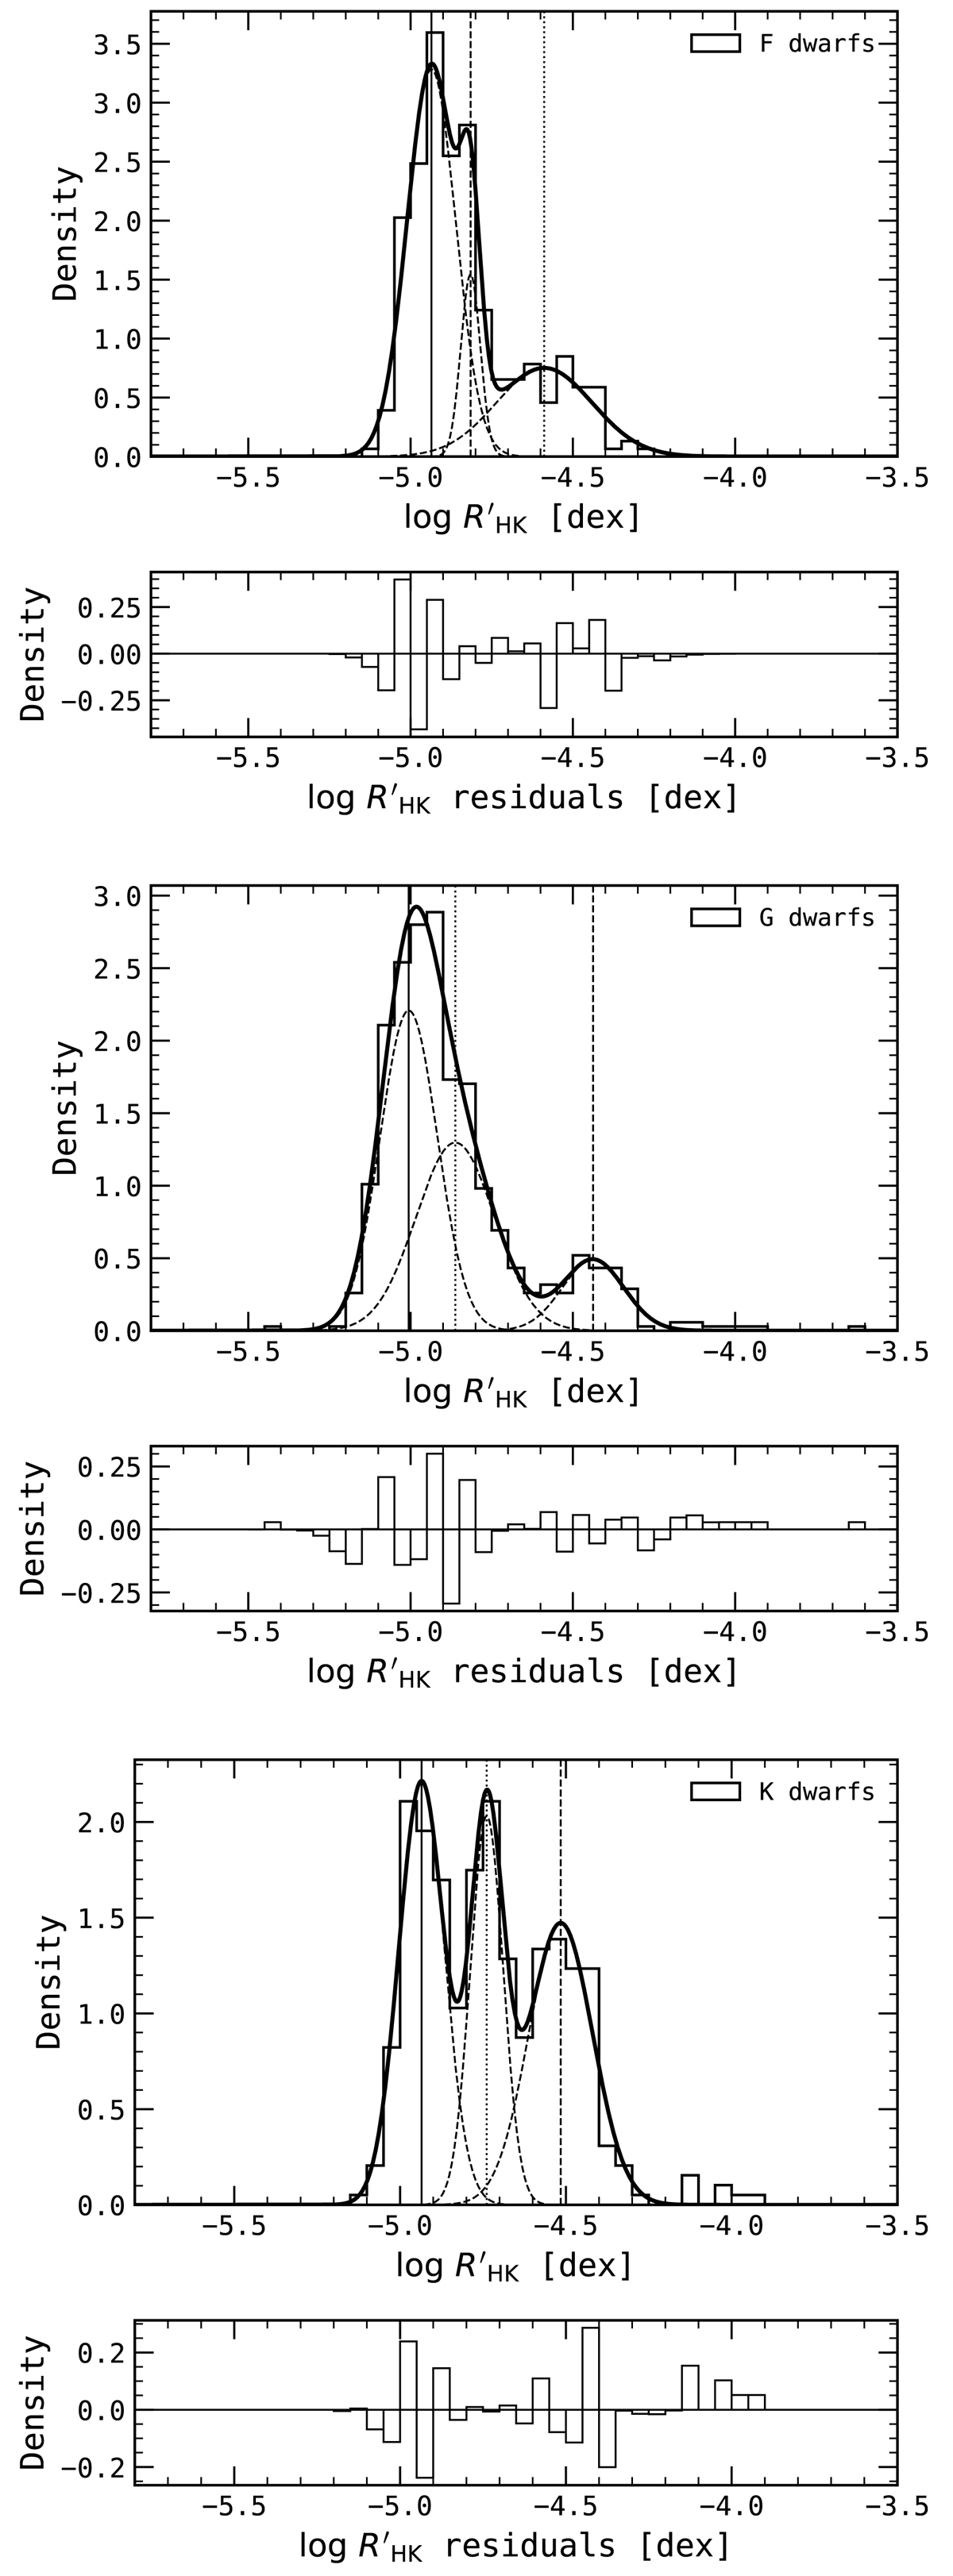
Distribution of median values of log ![]() for MS stars segregated into F (upper panel), G (middle panel), and K (lower panel) spectral types. The solid curve is the best-fit multi-Gaussian model and the dashed curves represent the individual Gaussians included in the model. The vertical lines mark the centres of the Gaussians. Below each plot are the residuals of the fit.
for MS stars segregated into F (upper panel), G (middle panel), and K (lower panel) spectral types. The solid curve is the best-fit multi-Gaussian model and the dashed curves represent the individual Gaussians included in the model. The vertical lines mark the centres of the Gaussians. Below each plot are the residuals of the fit.
Current usage metrics show cumulative count of Article Views (full-text article views including HTML views, PDF and ePub downloads, according to the available data) and Abstracts Views on Vision4Press platform.
Data correspond to usage on the plateform after 2015. The current usage metrics is available 48-96 hours after online publication and is updated daily on week days.
Initial download of the metrics may take a while.