Fig. 14.
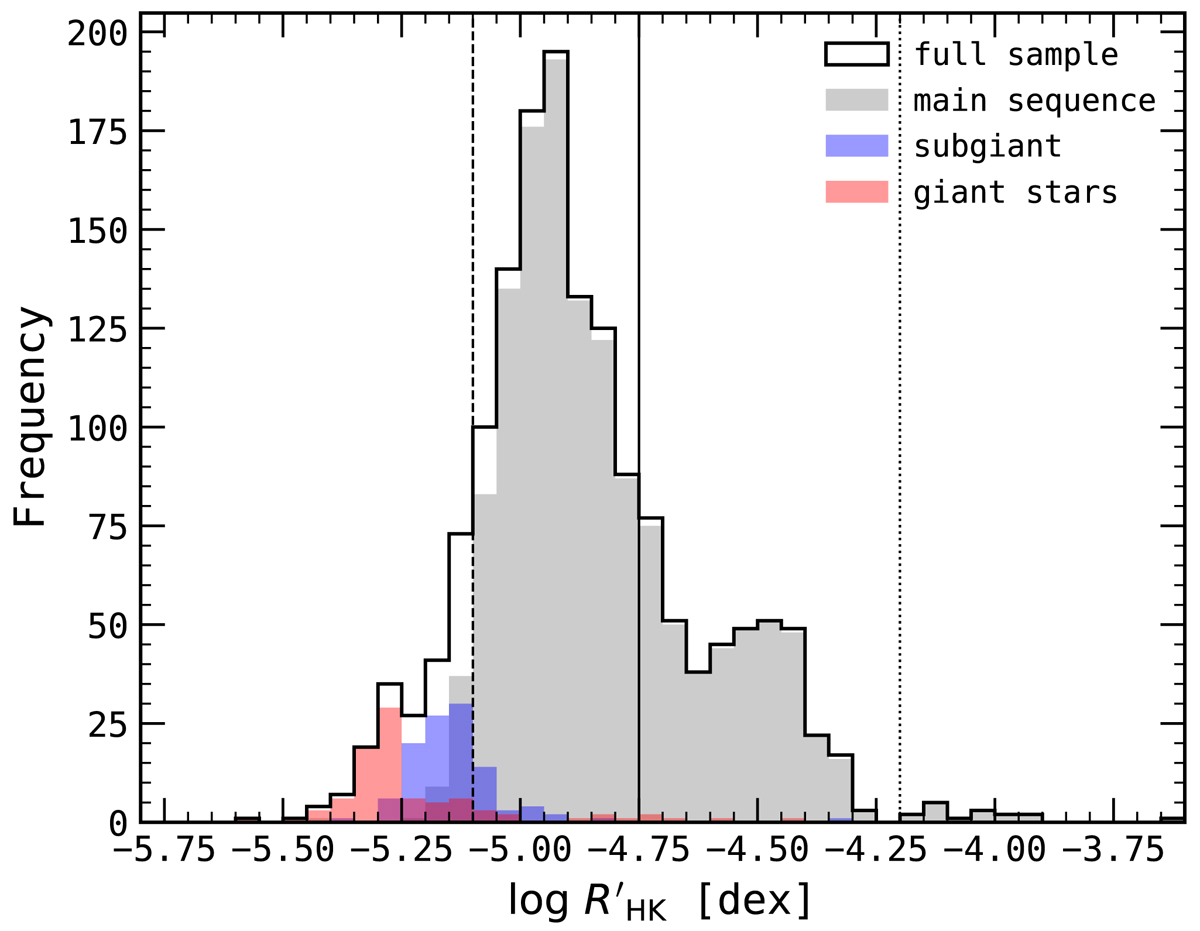
Distribution of median values of log ![]() segregated into MS (grey), subgiant (blue) and giant (red) luminosity classes. The black solid histogram is the full sample. The vertical lines separate different CE groups according to Henry et al. (1996): the dashed line at −5.1 dex separates VI from inactive stars, the solid line at −4.75 dex separates inactive from active stars, and the dotted line at −4.2 dex separates active from VA stars.
segregated into MS (grey), subgiant (blue) and giant (red) luminosity classes. The black solid histogram is the full sample. The vertical lines separate different CE groups according to Henry et al. (1996): the dashed line at −5.1 dex separates VI from inactive stars, the solid line at −4.75 dex separates inactive from active stars, and the dotted line at −4.2 dex separates active from VA stars.
Current usage metrics show cumulative count of Article Views (full-text article views including HTML views, PDF and ePub downloads, according to the available data) and Abstracts Views on Vision4Press platform.
Data correspond to usage on the plateform after 2015. The current usage metrics is available 48-96 hours after online publication and is updated daily on week days.
Initial download of the metrics may take a while.