Fig. 13.
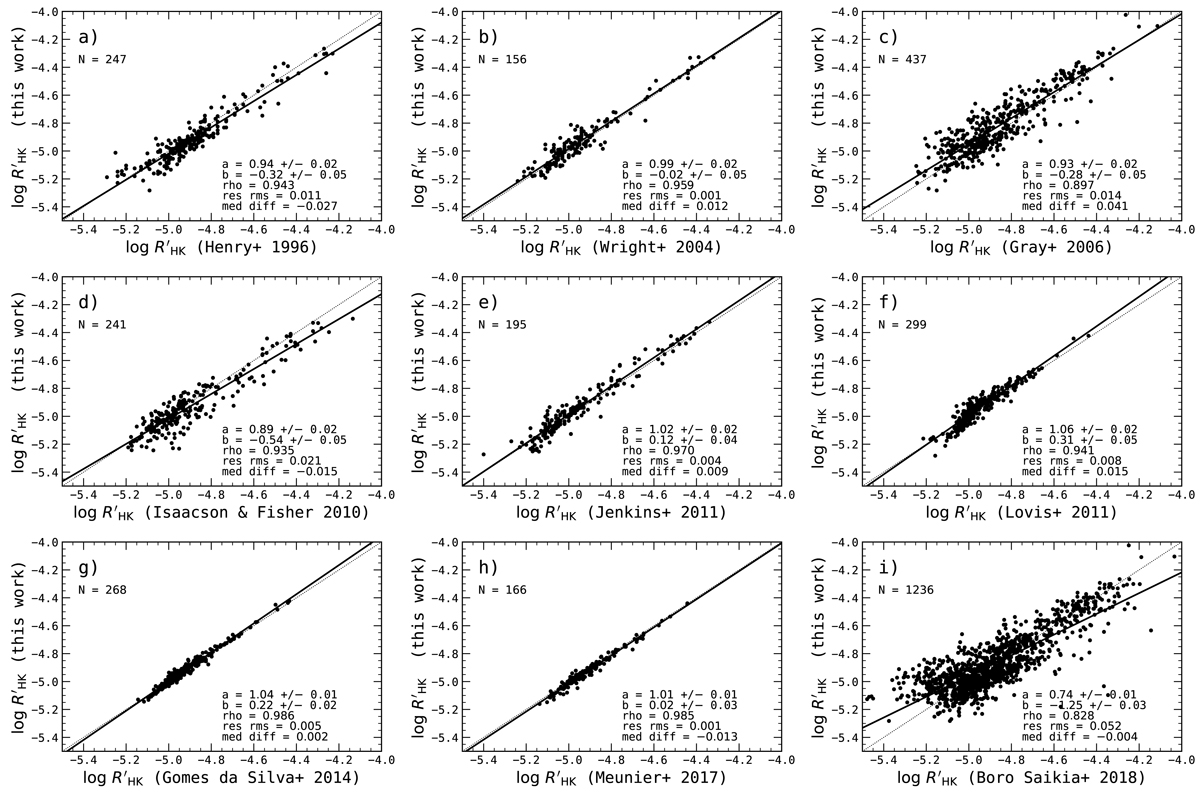
Comparison of our log ![]() values with those of (a) Henry et al. (1996), (b) Wright et al. (2004), (c) Gray et al. (2006), (d) Isaacson & Fischer (2010), (e) Jenkins et al. (2011), (f) Lovis et al. (2011), (g) Gomes da Silva et al. (2014), (h) Meunier et al. (2017), and (i) Boro Saikia et al. (2018). The black dotted line is the 1:1 identity, the black solid line the linear best fit, “N” the number of stars in common, “a” and “b” the slope and intercept of the fit, “rho” the correlation coefficient, “res rms” the rms of the residuals of the fit, and “med diff” is the median difference between the two data sets.
values with those of (a) Henry et al. (1996), (b) Wright et al. (2004), (c) Gray et al. (2006), (d) Isaacson & Fischer (2010), (e) Jenkins et al. (2011), (f) Lovis et al. (2011), (g) Gomes da Silva et al. (2014), (h) Meunier et al. (2017), and (i) Boro Saikia et al. (2018). The black dotted line is the 1:1 identity, the black solid line the linear best fit, “N” the number of stars in common, “a” and “b” the slope and intercept of the fit, “rho” the correlation coefficient, “res rms” the rms of the residuals of the fit, and “med diff” is the median difference between the two data sets.
Current usage metrics show cumulative count of Article Views (full-text article views including HTML views, PDF and ePub downloads, according to the available data) and Abstracts Views on Vision4Press platform.
Data correspond to usage on the plateform after 2015. The current usage metrics is available 48-96 hours after online publication and is updated daily on week days.
Initial download of the metrics may take a while.