Free Access
Fig. 11.
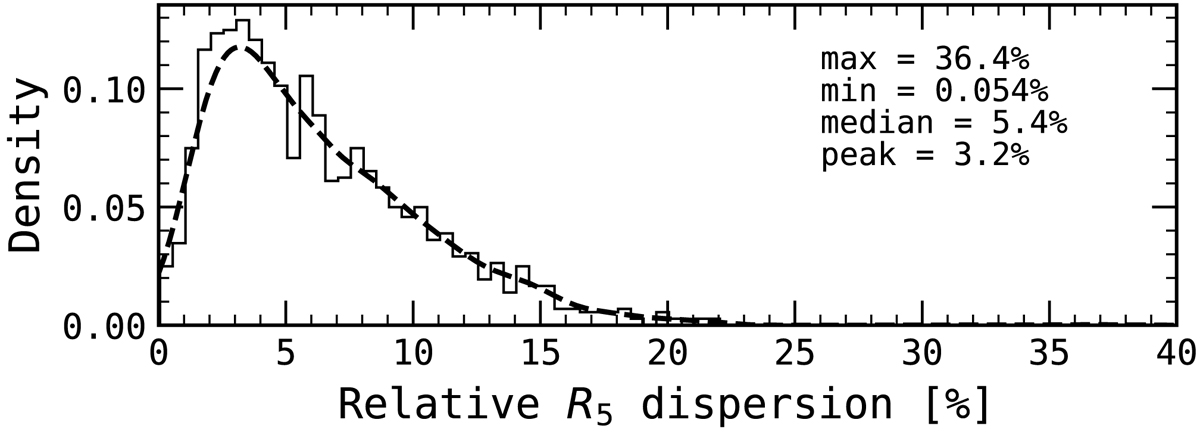
Relative dispersion of R5 for stars with more than one night of observations. The dashed line is the KDE with a peak at 3.2%. The histogram is truncated at 25% for visualisation purposes.
Current usage metrics show cumulative count of Article Views (full-text article views including HTML views, PDF and ePub downloads, according to the available data) and Abstracts Views on Vision4Press platform.
Data correspond to usage on the plateform after 2015. The current usage metrics is available 48-96 hours after online publication and is updated daily on week days.
Initial download of the metrics may take a while.