Fig. 6
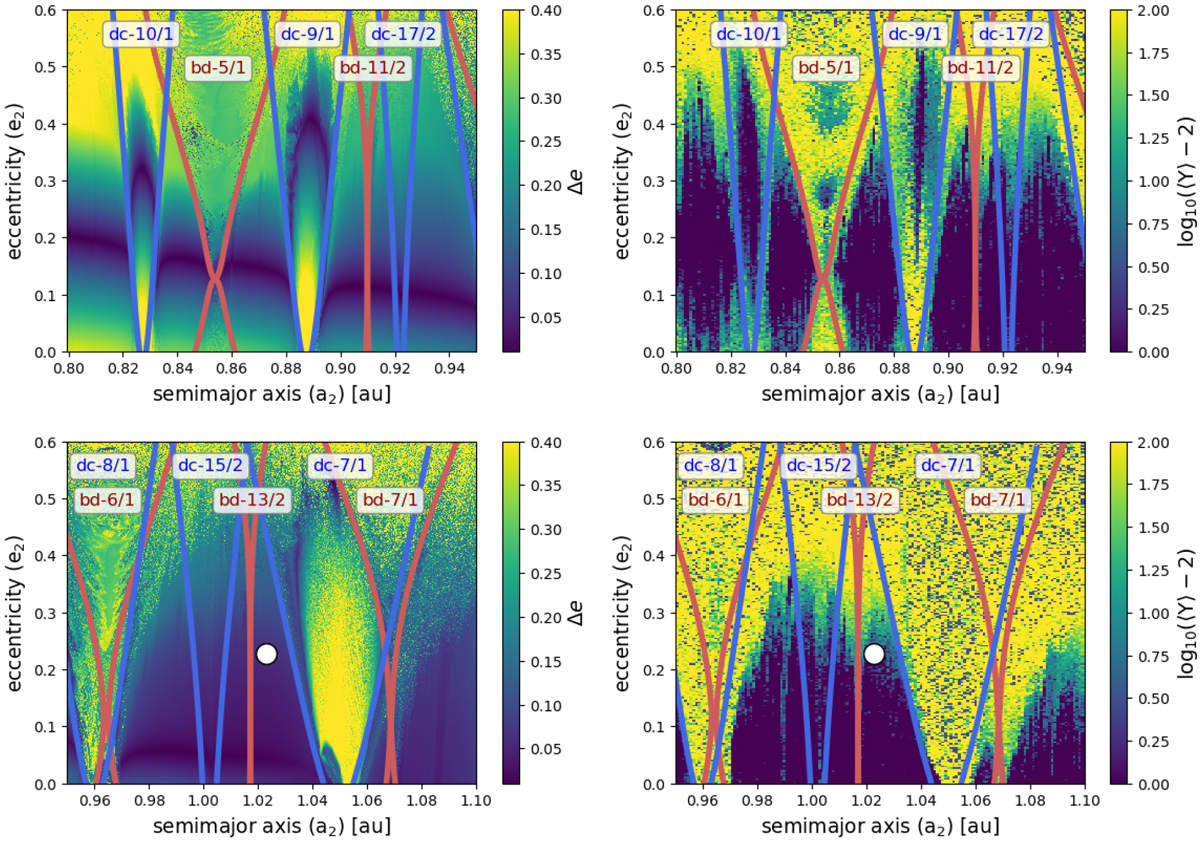
Top and bottom left-hand graphs: Δe dynamicalmap for system HD 74156 as obtained from the numerical integration of a grid of 900 × 900 initial conditions in the (a2, e2) plane. Upperplot: corresponds to a semimajor axis a2 ∈ [0.80, 0.95] au, and the bottom panel to a semimajor axis a2 ∈ [0.95, 1.10] au. The integration time was set to 103 yr, and escapes during this time span are highlighted in light yellow. The location of the middle planet is shown with a filled white circle. The libration widths of the most relevant MMRs determined analytically are highlighted in blue (resonances with the outer planet) and red (resonance with the inner planet). Top and bottomright-hand graphs: Megno map for the same plane. The set of initial conditions was reduced to a 300 × 300 grid, but the integration time was extended to 104 yr.
Current usage metrics show cumulative count of Article Views (full-text article views including HTML views, PDF and ePub downloads, according to the available data) and Abstracts Views on Vision4Press platform.
Data correspond to usage on the plateform after 2015. The current usage metrics is available 48-96 hours after online publication and is updated daily on week days.
Initial download of the metrics may take a while.