Free Access
Fig. C.87.
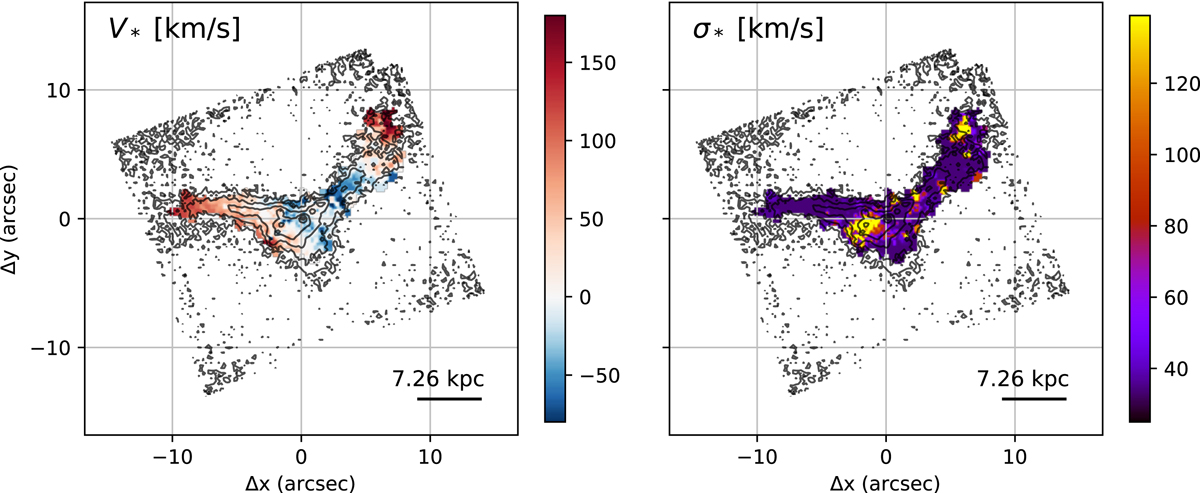
IRAS F22491−1808 stellar kinematic maps from the pPXF analysis with contours from HST/F160W. The left panel shows the stellar velocity V*, and the right panel represents the velocity dispersion σ*.
Current usage metrics show cumulative count of Article Views (full-text article views including HTML views, PDF and ePub downloads, according to the available data) and Abstracts Views on Vision4Press platform.
Data correspond to usage on the plateform after 2015. The current usage metrics is available 48-96 hours after online publication and is updated daily on week days.
Initial download of the metrics may take a while.